• Skip to primary navigation
  • Skip to main content
  • Skip to primary sidebar
  • Skip to footer

ForexSchoolOnline.com

Learn to Trade Forex Online

  • Compare Brokers
    • Broker Type
      • Paypal Brokers
      • Swap-Free Brokers
      • Low Spread Brokers
      • ECN / STP Brokers
      • Market Maker Brokers
      • Non Dealing Desk Brokers
      • Low Minimum Deposit Brokers
    • Country
      • Brokers for Australia
      • Brokers for South Africa
      • Brokers for the UK
      • Brokers for the US
      • Brokers for Nigeria
    • Regulation
      • FCA Regulated Brokers
      • ASIC Regulated Brokers
      • FSCA Regulated Brokers
      • CFTC Regulated Brokers
    • Platform
      • MT4 Brokers
      • MT5 Forex Brokers
    • Strategies
      • Hedging Forex Brokers
      • Scalping Forex Brokers
      • Carry Trade Forex Brokers
      • Brokers for Indicators and EA’s
  • Start Here
    • Start Trading Guide
    • Beginner Trading Lessons
  • Free Forex Course
    • Public Login
    • Register
    • Password recovery
  • Lessons
    • Strategies
    • Videos
    • MT4 Guides
    • Money Management
  • Trade Setups
  • Tools
    • Correct Free Demo Charts
    • Forex Journal Download
    • Position Size Calculator
    • FULL List of Tools
    • Forex Demo Accounts
  • Price Action Guide
  • Free Course

Dow Jones & S+P 500 Move Into All Time Highs And Form Daily Bullish Engulfing Bars | 14th Nov 13

Johnathon Fox
11/14/2013 | UPDATED ON: 08/05/2019

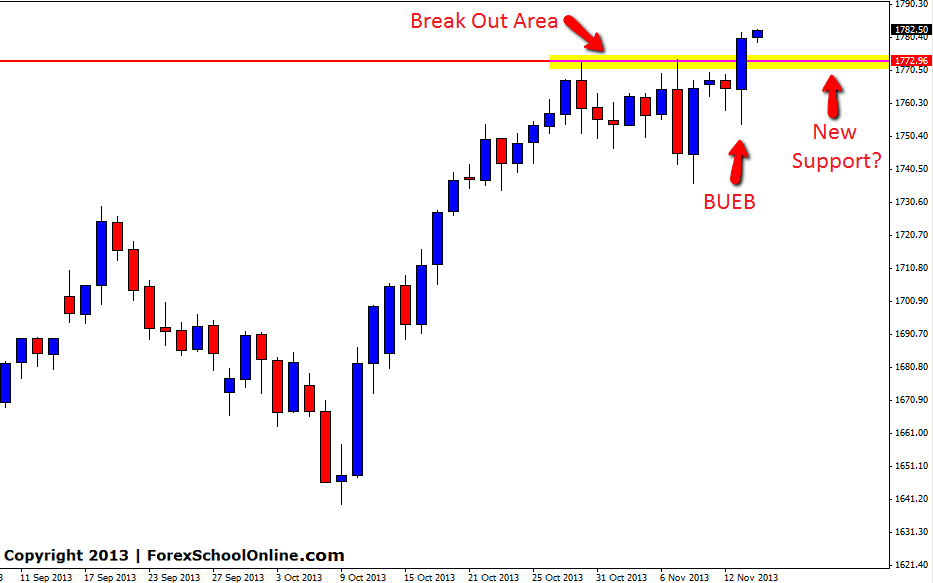
Both the Down Jones and the S+P 500 have burst higher and closed at all time highs. Both these markets have engulfed their previous candles and created bullish engulfing bars (BUEB). In this case of the S+P 500 price has broken out of the recent consolidation that price had been stuck in and broken out of the near term resistance and break out area to close out and above. Price has now broken out and above and formed a large and commanding BUEB.

The level that price has closed above that was acting as resistance and break out area could not act as a price flip and a new support area should price move lower. Because price is at all time highs, this market could now be tricky to gauge should it move higher. Price action traders have to levels to monitor, so traders will have to look to the price action clues that price is giving off candle by candle. Whilst this is never the ideal situation because traders can tend to overreact to each individual candle, when given this unusual situation monitoring price is one of the best options when looking for where price is looking to go and when it may reverse or continue.


S+P 500 Daily Chart

S+P 500 price action chart


Recommended Broker

  • Broker
  • Min Deposit
  • Benefits
  • Score
  • Visit Broker

$200

T&Cs Apply
  • The Lowest Trading Costs
  • 50% Welcome Bonus
  • Award-winning 24 Hour Support
5
Trade Now FreeBets Reviews
Reviews

About Johnathon Fox

Johnathon is a Forex and Futures trader with over ten years trading experience who also acts as a mentor and coach to thousands and has written for some of the biggest finance and trading sites in the world.

View all posts by Johnathon Fox →
Previous Post: « AUDCHF Shoots Lower After False Break Engulfing Bar | 13th Nov 2013
Next Post: EURCAD Bearish Pin Bar & AUDNZD Shoots Lower After Breaking Engulfing Bar Low | 15th Nov 13 »

Reader Interactions

Leave a Reply Cancel reply

Your email address will not be published. Required fields are marked *

Primary Sidebar

Forex School Online

High Probability Price Action Trading

How to make, manage and take profit from trades in the markets

Start Learning (It's Free!)

Turn Your Trades into Winners!

The Price action course is the in-depth advanced training on assessing, making and managing high probability price action trades.

Sign up for Free!

Recommended Broker

  • Broker
  • Min Deposit
  • Benefits
  • Score
  • Visit Broker

$200

T&Cs Apply
  • The Lowest Trading Costs
  • 50% Welcome Bonus
  • Award-winning 24 Hour Support
5
Trade Now FreeBets Reviews
Reviews

Footer

Get Our FREE Course, Bonus Strategies & Indicators!
X
Join Us Now!

Your capital is at risk.

X

CORNERSTONE LESSONS

Forex Trading for Beginners

Price Action Trading

How to Trade Forex

Technical Analysis

Forex Charts

Forex Trading Strategies

Money Management 

Compare Brokers

Best Forex Brokers

Forex Demo Accounts

Best Forex Trading Platforms

Forex Apps

Swap Fee Accounts

MT4 Brokers

CATEGORIES

Forex Videos

Trading Lessons

Weekly Trade Ideas

Start Here Guide

ForexSchoolOnline.com helps individual traders learn how to trade the Forex market

WARNING: The content on this site should not be considered investment advice and we are not authorised to provide investment advice. Nothing on this website is an endorsement or recommendation of a particular trading strategy or investment decision. The information on this website is general in nature so you must consider the information in light of your objectives, financial situation and needs.

Investing is speculative. When investing your capital is at risk. This site is not intended for use in jurisdictions in which the trading or investments described are prohibited and should only be used by such persons and in such ways as are legally permitted. Your investment may not qualify for investor protection in your country or state of residence, so please conduct your own due diligence or obtain advice where necessary. This website is free for you to use but we may receive a commission from the companies we feature on this site.

We Introduce people to the world of currency trading. and provide educational content to help them learn how to become profitable traders. we're also a community of traders that support each other on our daily trading journey

Forexschoolonline.com is not a financial advisor. Do your research before investing your funds in any financial asset or presented product or event. We are not responsible for your investing results.

Copyright © Forex School Online Sitemap  - Privacy Policy - Disclaimers & Terms of Use - CONTACT US