Weekly Price Action Trade Ideas – 17th to 22nd March 2019
Markets Discussed in This Weeks Trade Ideas: AUDUSD, NZDJPY, AUDCHF and US500
Note: We Use Correct ‘New York Close 5 Day Charts’ – You can read about why we use these and how to download the correct free charts at Correct Free New York Close Demo Charts
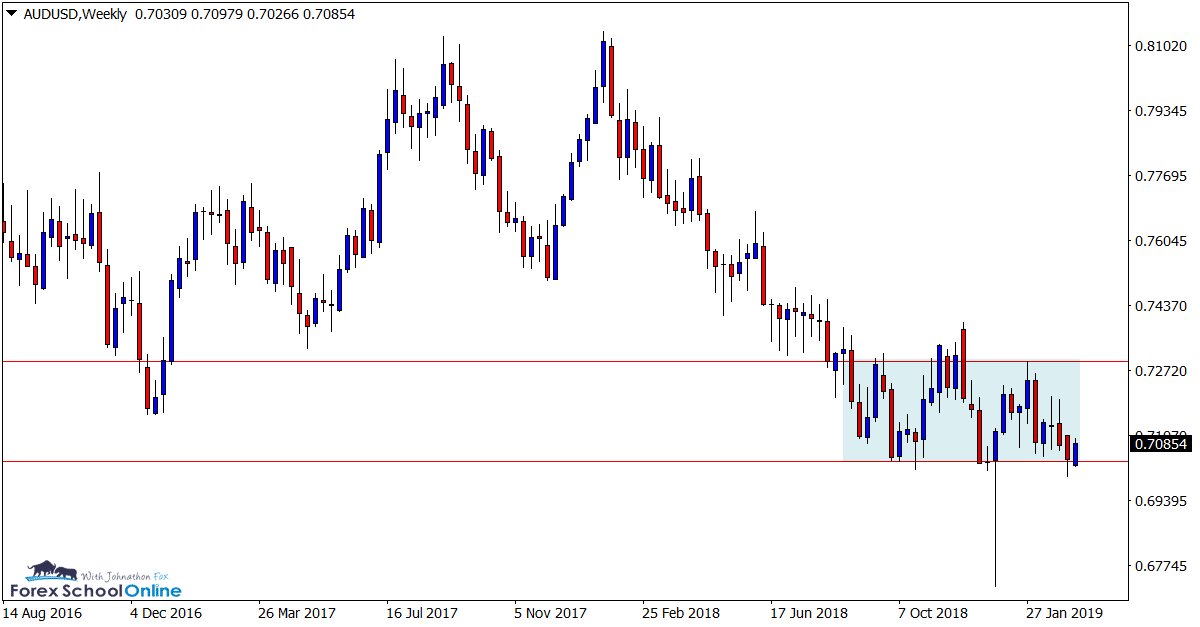
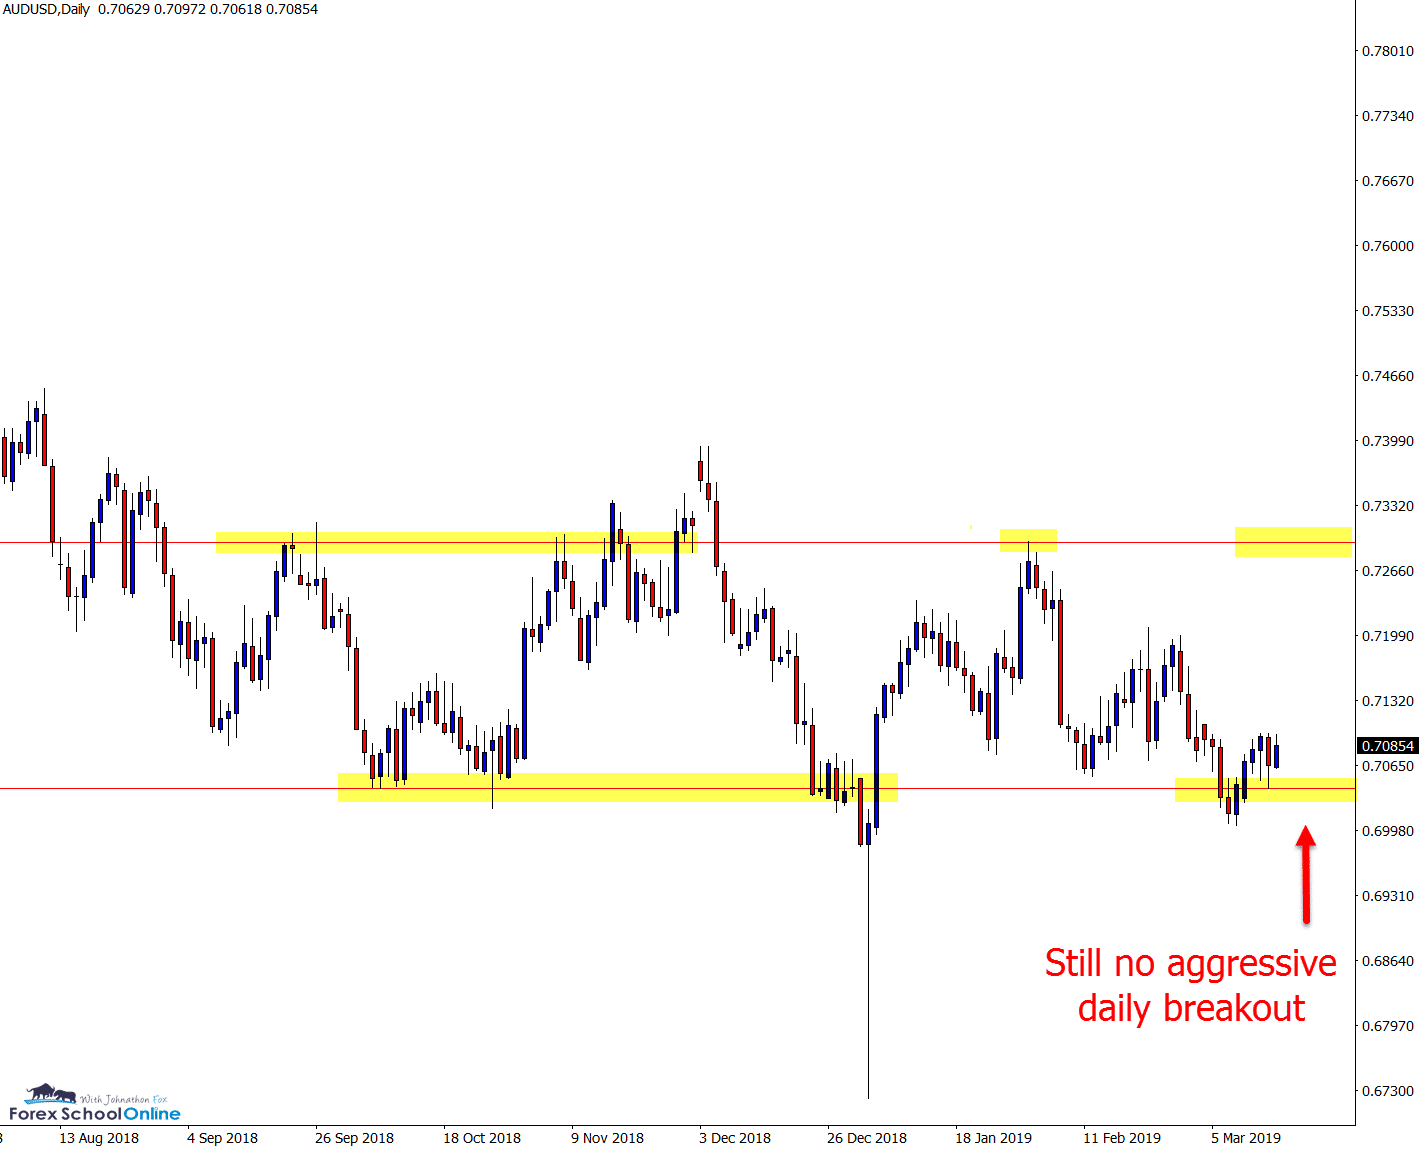
AUDUSD Weekly & Daily Charts
Price Still Stuck Inside Box / Range
This is a market we have been watching for quite some time now to see if price can make a solid and confirmed breakout either higher or lower through it’s ranging box.
Whilst price has made breaks and tests on the intraday time frame, as the weekly and daily charts show below; we are as yet to get a clear breakout either way.
Price had been clearly trending lower before moving into this consolidation range pattern. Often price will break in the same direction it had been trading in before it moved into consolidation.
We will regularly see that the longer that price stays winding up and attempting to breakout of a level, the stronger the breakout is when it eventually occurs; meaning it can lead to a lot of fast paced high probability trade setups.
Weekly Chart
Daily Chart
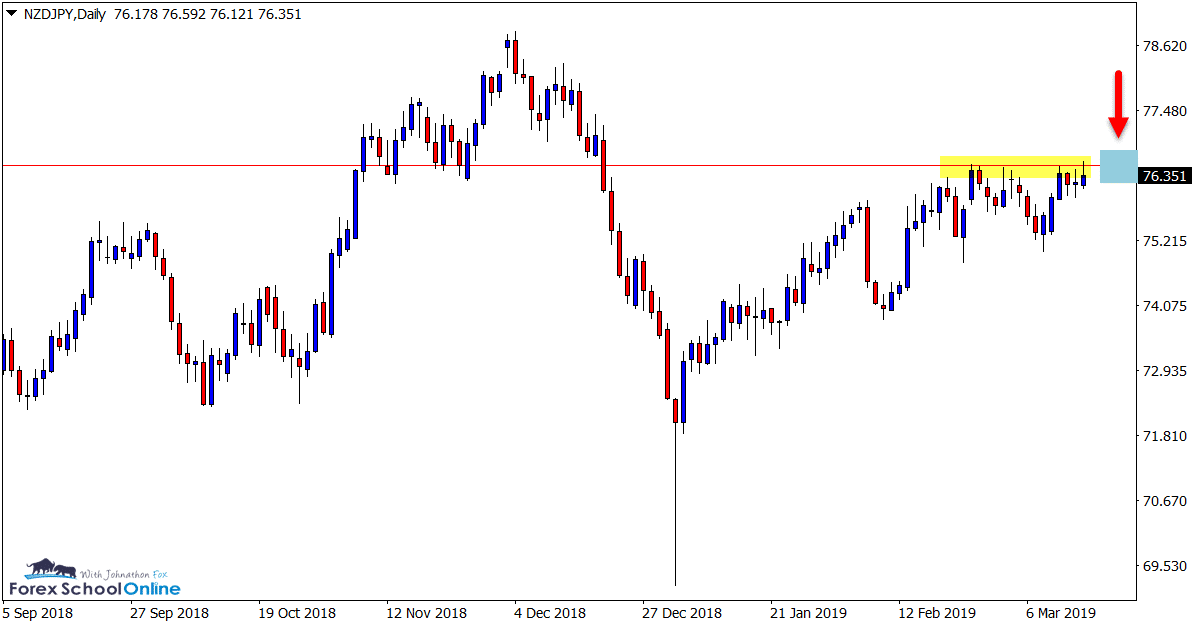
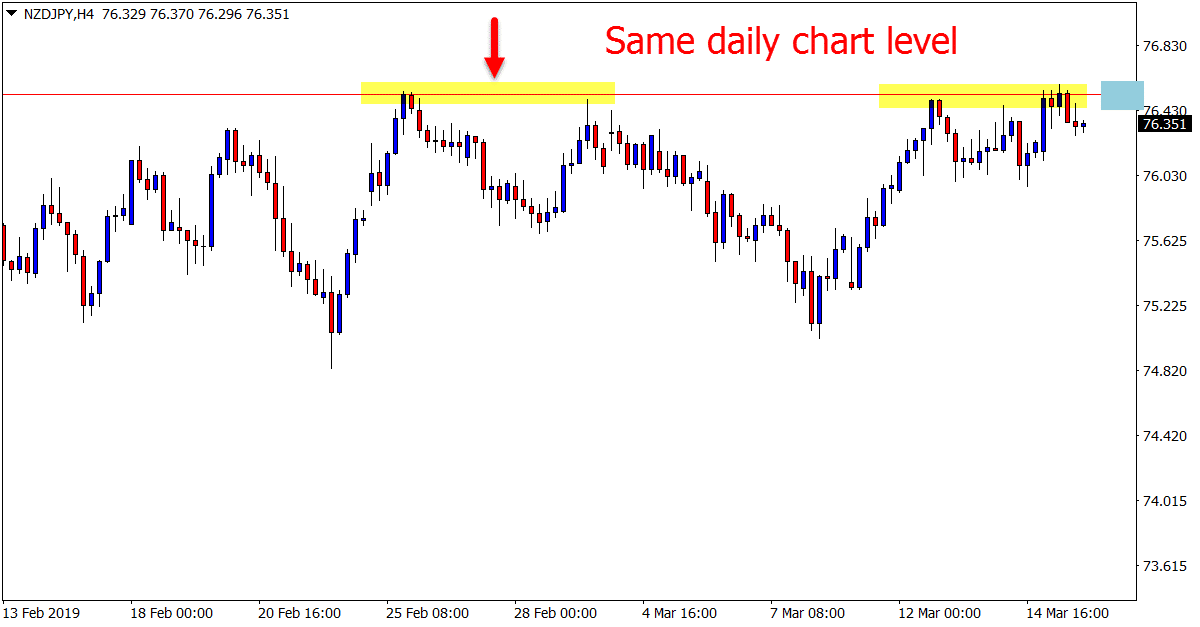
NZDJPY Daily and 4 Hour Charts
Big Test of Daily Resistance in Coming Sessions
Price action on the daily chart of the NZDJPY has run into a brick wall in the last two weeks after making a solid move higher.
The daily time-frame chart attached below shows how price is now making a test of the daily chart resistance level. This level looks to be key in the coming sessions and proves as a large watch for price action traders.
A solid breakout could see price move quickly into the 77.20 area with potential intraday trades on the 4 hour and 1 hour charts forming.
Daily Chart
4 hour Chart
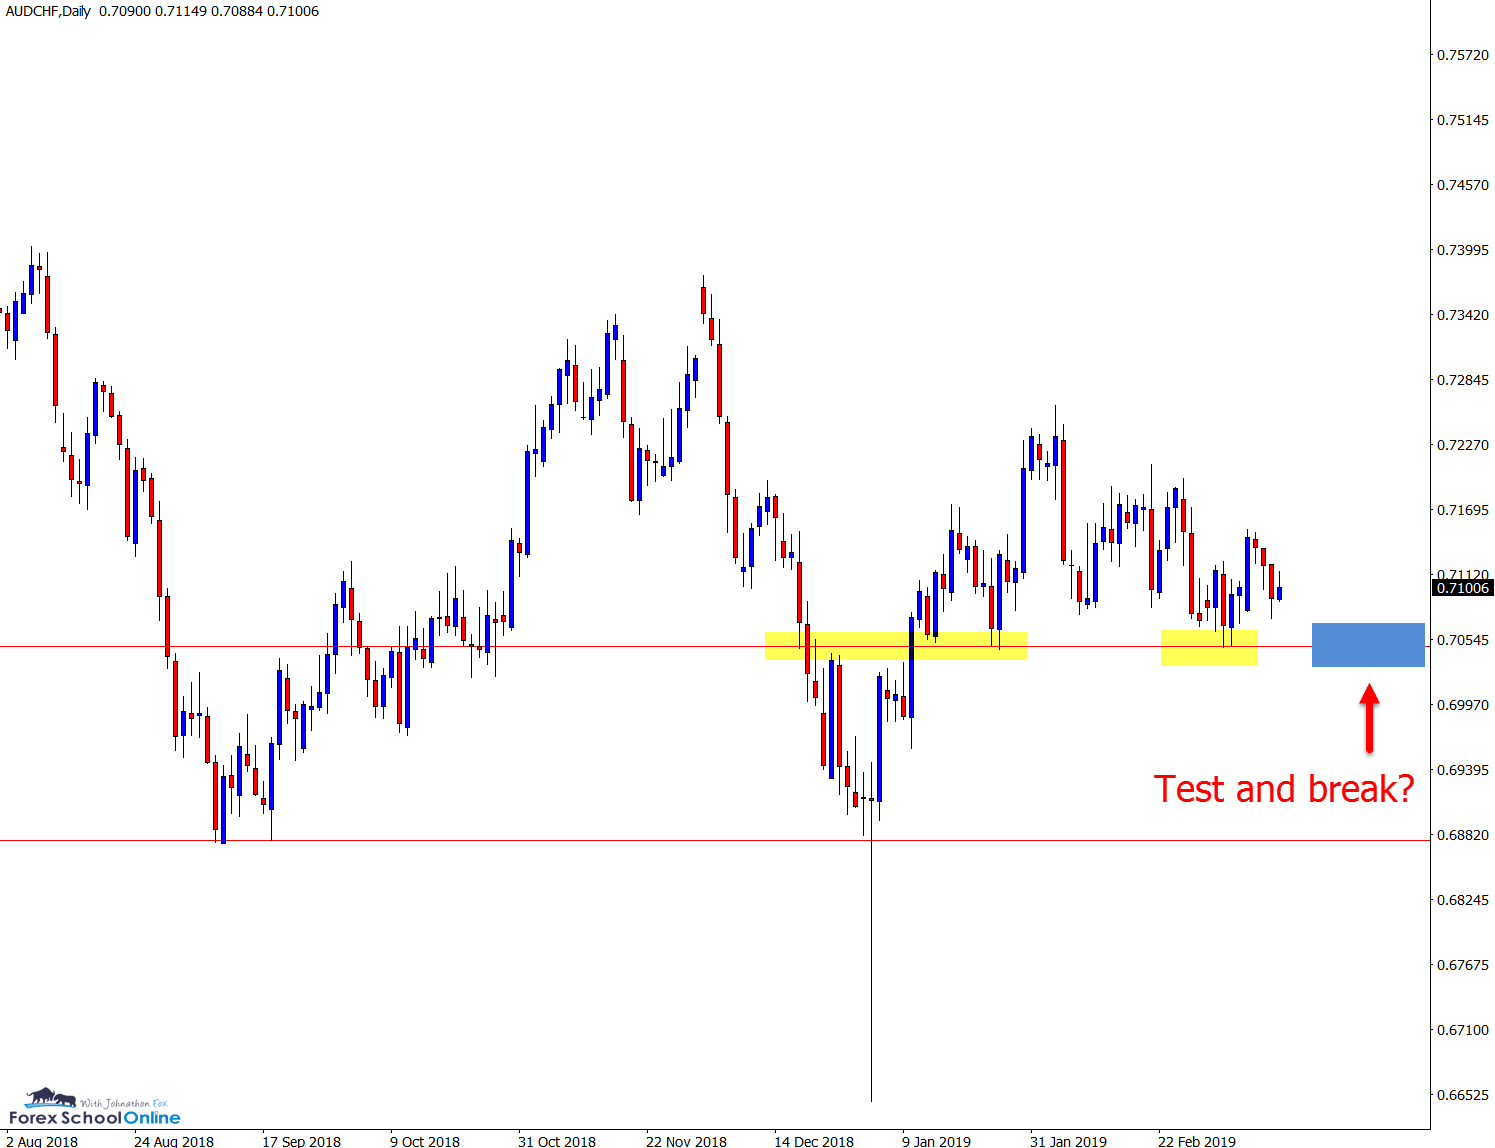
AUDCHF Daily Chart
Potential Test and Breakout
Price action on the daily chart of the AUDCHF has been making lower highs in recent weeks, but has been unable to break lower and through the major support level.
As the chart shows below; this week could prove crucial for where price wants to make it’s next move.
A test and breakout lower could open the way for traders to hunt breakout trades and high probability breakout and re-test trade setups.
Daily Chart
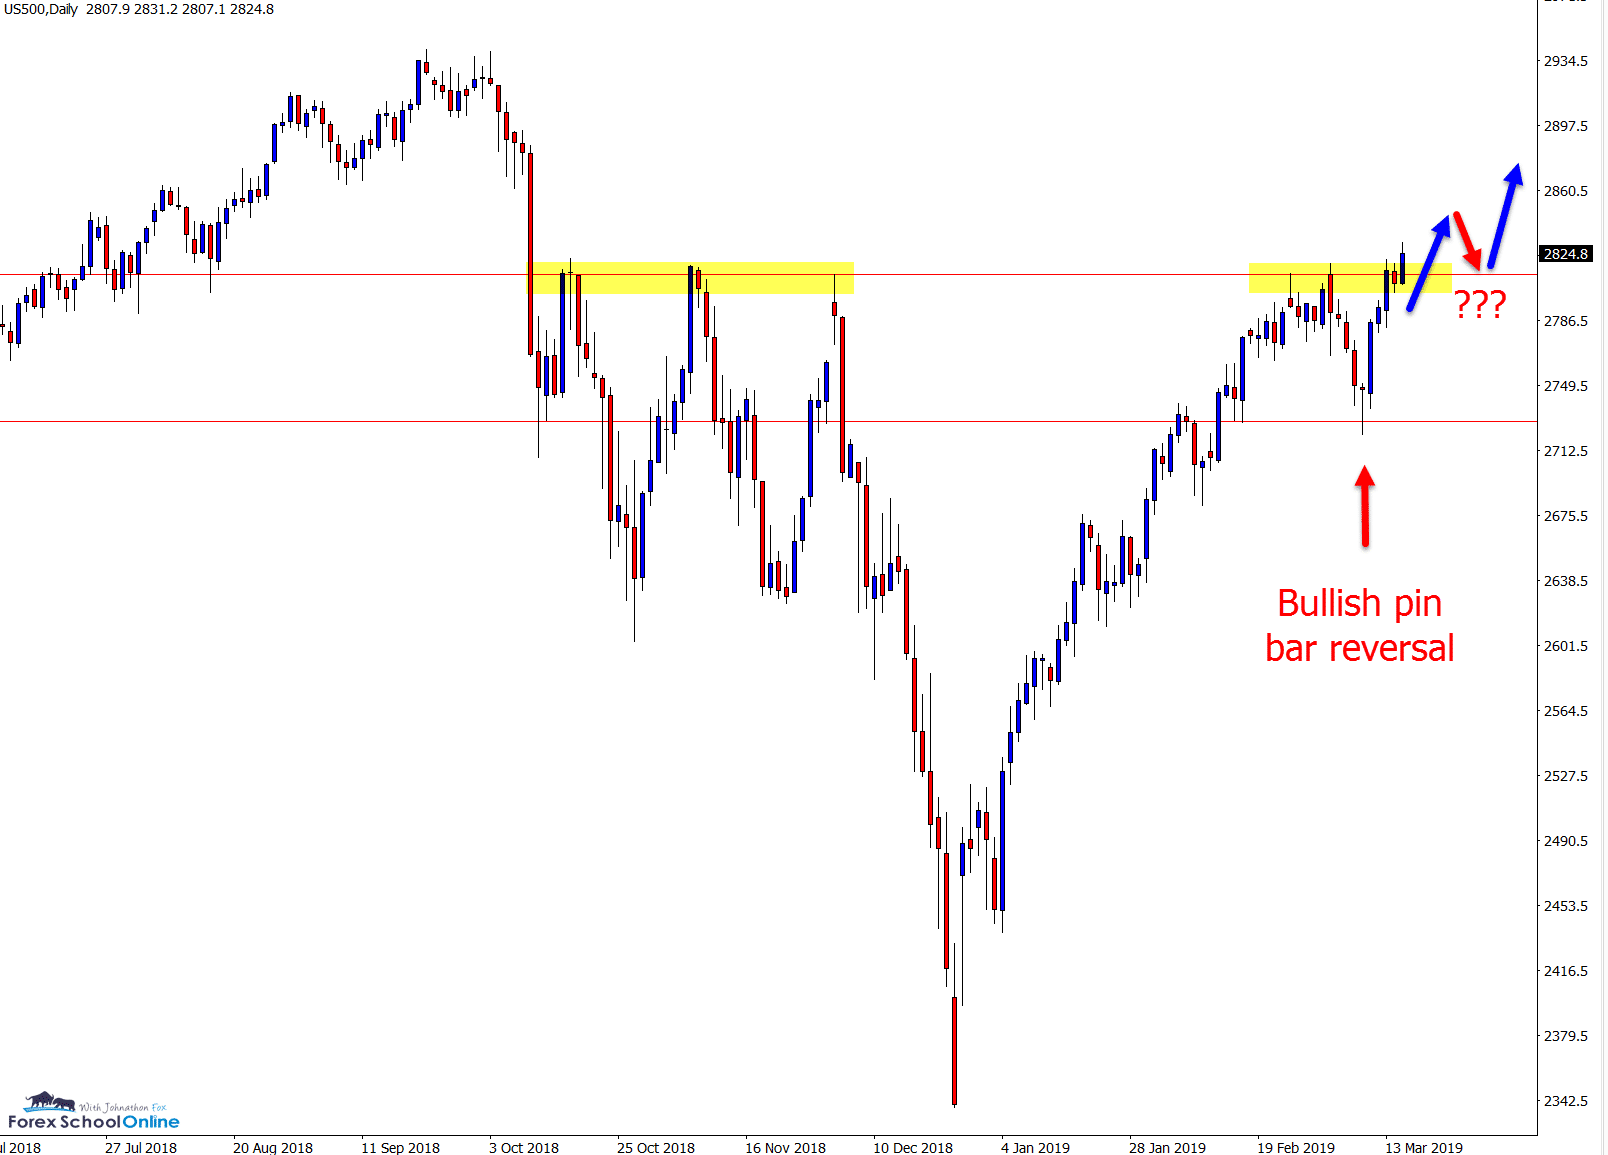
US500 Daily Chart
Watching for Break & Re-test
In last week’s trade ideas posted on the 10th of March we discussed this market and the small daily chart bullish pin bar price had formed rejecting the support level.
Price has since popped higher off the back of this pin bar and is now once again attempting to breakout and through the major highs and resistance.
A breakout of this level and we could see price make a strong, free-flowing move higher in-line with the aggressive shorter term trend price has been moving in. This could also open the way for bullish breakout and quick breakout and intraday trades.
Daily Chart
Charts in Focus Note: All views, discussions and posts in the ‘charts in focus’ are the view of Forex School Online and are not recommendations or trading advice. All posts are general in nature and are not advice to buy or sell.
Please leave questions or comments in the comments section below;

Leave a Reply