Weekly Price Action Trade Ideas – 22nd to 26th April
Markets Discussed in This Week’s Trade Ideas: AUDPY, AUDUSD, NZDJPY and OIL v USD.
Note: We Use Correct ‘New York Close 5 Day Charts’ – You can read about why we use these and how to download the correct free charts at Correct Free New York Close Demo Charts
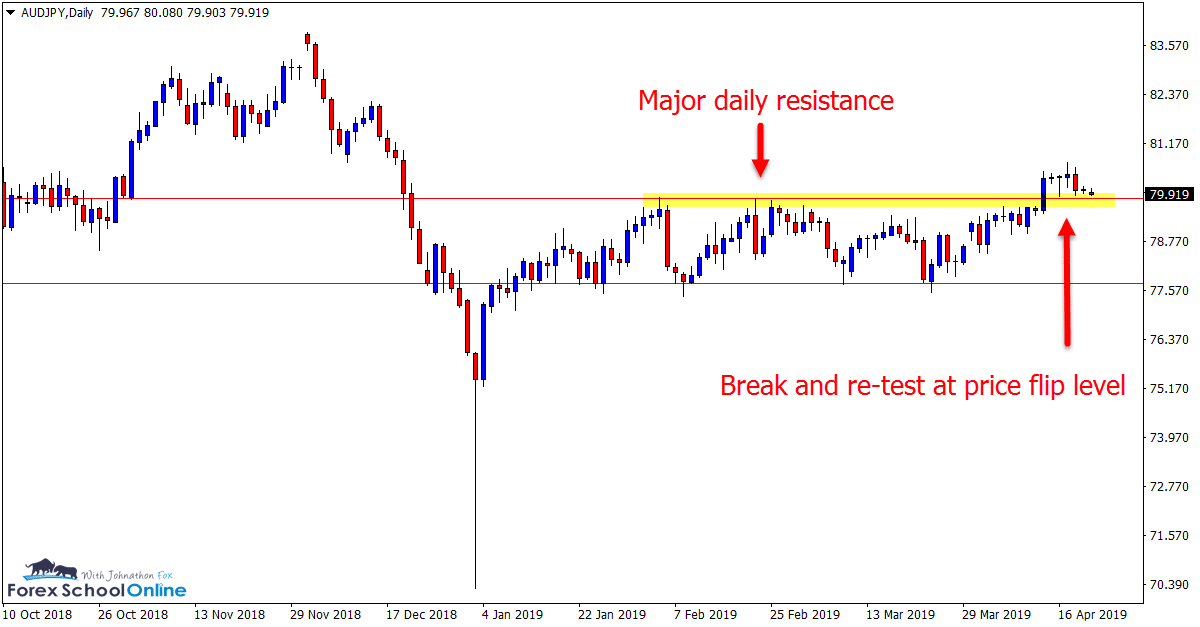
AUDJPY Daily Chart
Break and Quick Re-test at Price Flip Level
Price action on the daily chart of the AUDJPY has broken out of the major range it has recently been trading in.
In the trade ideas posted on the 8th April we discussed this market and how price was priming for a break either higher or lower through the sideways pattern price had been trading in.
As the chart shows below; after breaking this level price has stalled, formed an inside bar on the daily chart and is now re-testing. If this level can hold as an old resistance and new support flip level it could form a base for the next move higher.
Daily Chart
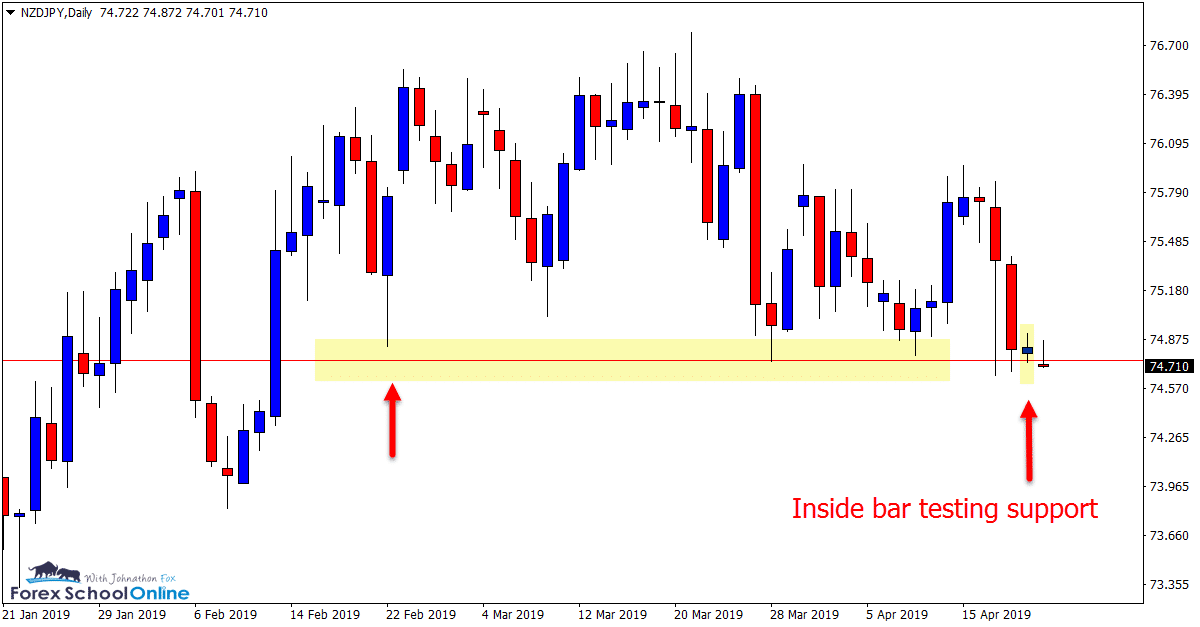
NZDJPY Daily Chart
Inside Bar Testing Support
This is a market we have been watching and discussing for some time now as price has been testing the major daily support level without being able to breakout and move below.
Price has recently formed an indecision inside bar right at this daily chart support with price still showing no clear break either way.
Until this market either makes a clear break lower, or a definitive false break, there does not look to be much to trade.
Daily Chart
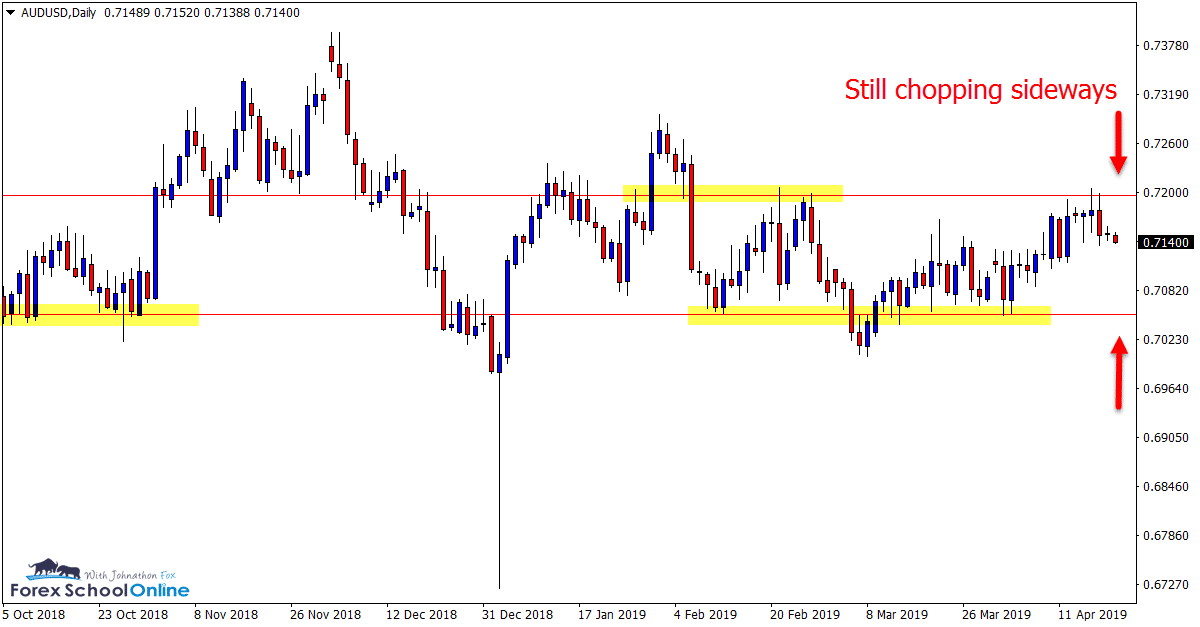
AUDUSD Daily Chart
Still Bubbling Between Range Levels
This pair has now been bubbling along sideways chopping up and down without really going anywhere concrete for many months going right back to last year.
These types of markets can be the trickiest to trade and especially manage when in trades. The simple reason for this is; whilst trades can be found, when price is whipping or chopping direction it makes it a lot more likely you will be stopped out even if you do pick the direction of the market correctly.
One of the best tactics can be to look for high probability reversal triggers when price makes a test of the range high or low on smaller intraday charts such as the 4 hour and 1 hour charts. If price then breaks out you can look to get into the breakout.
Daily Chart
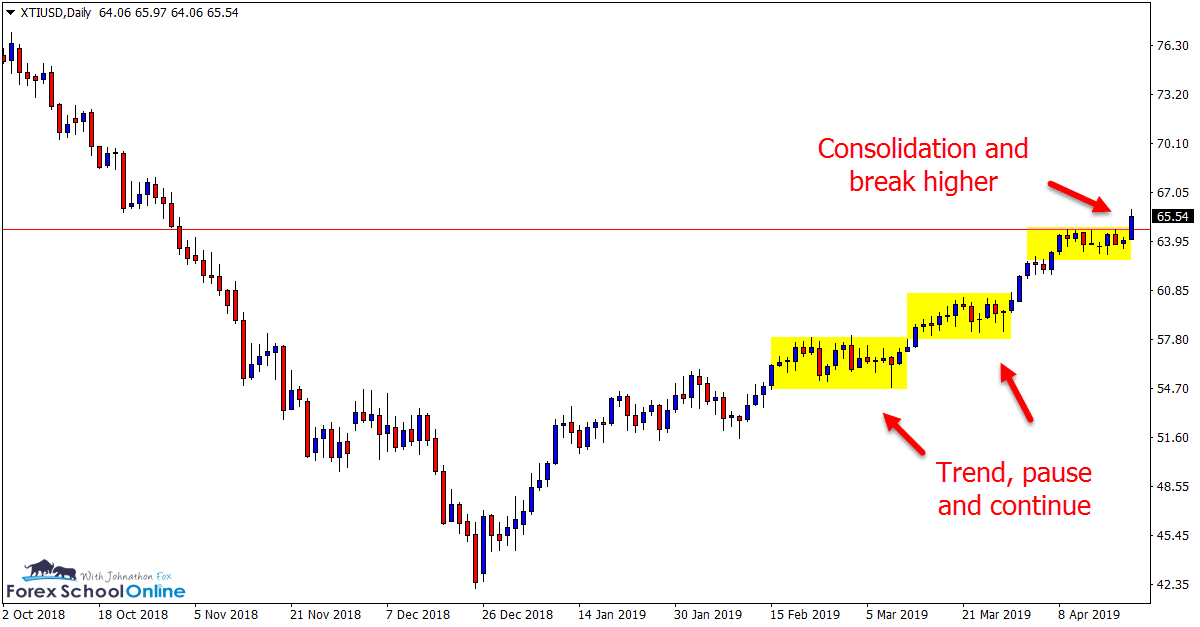
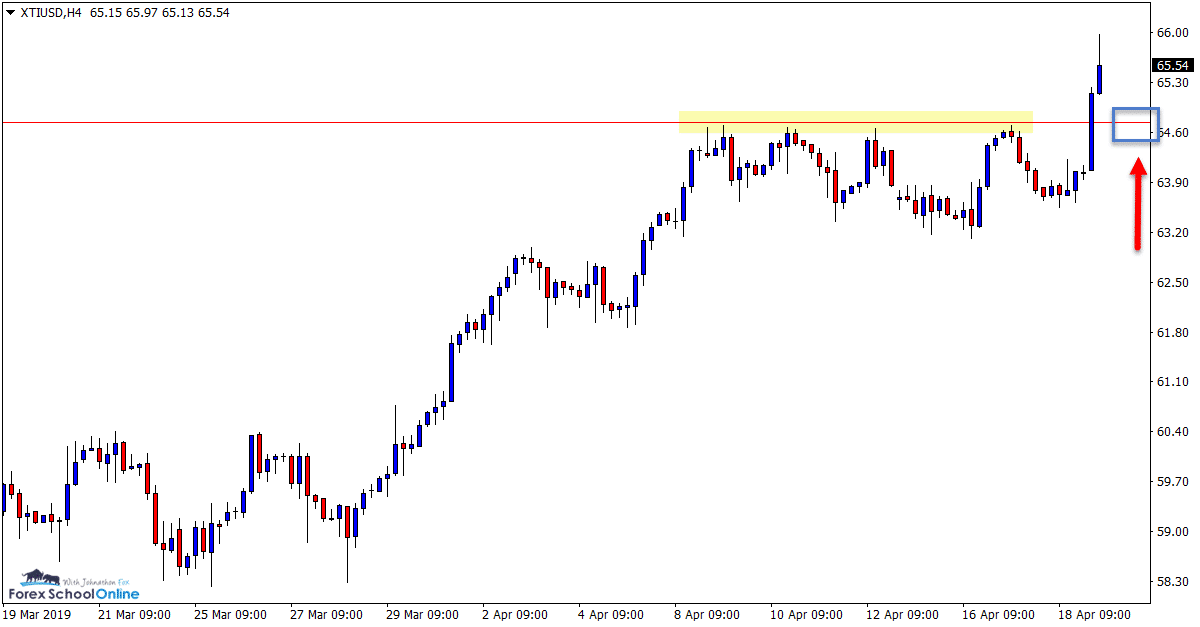
Oil Daily and 4 Hour Charts
Move, Pause and Break
The daily chart of this market has formed a textbook move higher in recent times.
It is not very often that price moves in such a clear pattern and we see price move > pause / consolidate and > continue.
Overall this is how the price action of the markets regularly behaves, however; it is not often we see it as clear as we can see here.
Price has now broken out of its most recent consolidation pattern and if you zoom your daily chart out you will note it has just hit the overhead resistance.
If price rotates back lower we could watch the old breakout highs to see if it acts as an old resistance and potential new support area.
Daily Chart
4 Hour Chart
Charts in Focus Note: All views, discussions and posts in the ‘charts in focus’ are the view of Forex School Online and are not recommendations or trading advice. All posts are general in nature and are not advice to buy or sell.
Please leave questions or comments in the comments section below;

Leave a Reply