Fibonacci Retracement Trading Strategy With Price Action Forex
Fibonacci is a tool popular with many technical analysis and price action traders that was designed in the 13th century by a mathematician ‘Leonardo Fibonacci’.
In this lesson we focus on two major levels that occur as pull-backs or rotations to hunt for trade setups; the ‘golden ratio’ and the 50% level.
What is Fibonacci?
Fibonacci is a well-known mathematical series of numbers with each number being the sum of the previous two.
The Fibonacci sequence of numbers are; 0, 1, 1, 2, 3, 5, 8, 13, 21, 34, 55, 89, 144, etc.
The “Golden Ratio” and one of the two major levels we focus on in this lesson is the 61.8%.
This ratio is found by dividing one number in the series by the number that follows it. For example; 89 divided by 144 equals 0.618.
What is Fibonacci Retracement Trading Strategy With Price Action Forex?
Fibonacci can be used as a tool in the markets by taking two extreme points. These levels are normally the high and the low of a stock or Forex pair. The vertical distance is then divided into the key Fibonacci ratios.
The key levels we concentrate on when trading the markets are the 50% and 61% levels.
Quick Note: The 50% level is not a Fibonacci level, but a level based on the ‘Dow 50% level’.
This theory states that the move higher or lower is more likely to continue and reach the recent highs or lows if price has moved strongly past the 50% level.
The 50% level also acts as a major psychological level, in the same way that major support and resistance levels and Very Big Round Numbers do – especially when combined.
The 50% level is a very popular level and this is why you will find the 50% level on your Fibonacci tool when you open it in your chart.
Traders can get carried away when using Fibonacci levels and they can fall into a trap of trying to place a ‘Fibo’ tool on every market.
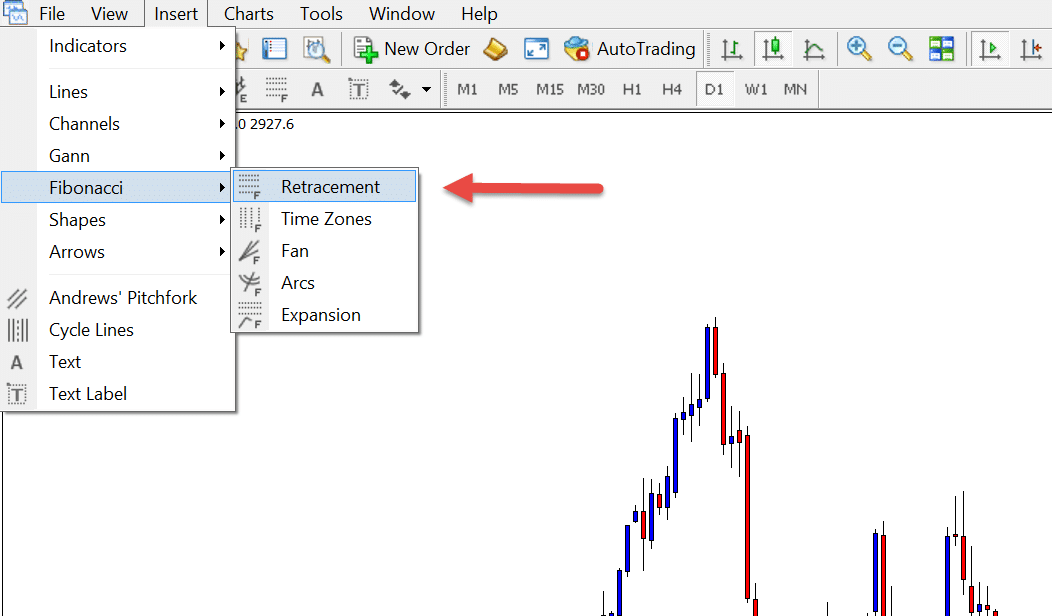
How to Use the Fibonacci Retracement Tool
Firstly navigate to your MT4 or MT5 Charts and select the “Insert” > “Fibonacci” > “Retracement”
To use the Fibonacci tool we can map the high and the low of the move and be guided to where a logical point in the trend will be for price to reverse or continue. These are the levels where we can look for price action triggers to get into the trend.
Looking to get aboard the trend is always the best course of action as the trend really is our friend. The Fibonacci tool allows traders to look at a market and have an idea of where price may roll back over and continue with the trend.
To mark the Fibonacci we place it from the extreme high to the extreme low or vice versa depending on the trend.
For example; in a downtrend we start by marking the Fibonacci from the extreme high of the move to the low.
Just remember, whichever way the trend is going is the way we put the Fibonacci tool. So if the trend has gone from high to low, then that’s what we do with the Fibonacci. If the trend has gone from low to high, then that’s the way we put the Fibonacci.
When Not to Use the Fibonacci Strategy?
The times you choose NOT to use the Fibonacci tool are just as important as when you choose to.
We only want to deploy Fibonacci in the most obvious of trends and markets. We do not want to use the Fibonacci tool just for the sake of using another tool!
We can use Fibonacci as a guide of where to look for price to give us a signal it wants to roll back over in the direction of the trend. We only enter when Fibonacci lines up with other support and resistance and price gives us a clear signal such as a Pin Bar or Engulfing Bar.
When Fibonacci continues past the 61.8% level it is generally thought that the trend is over and another trend may be beginning or price could be going to test the recent extreme highs or lows.
We DO NOT Want to use the Fibonacci Tool;
- In every single market we find.
- In choppy and sideways markets where price is whipsawing often.
- By itself. It must be backed by other forms of support or resistance.
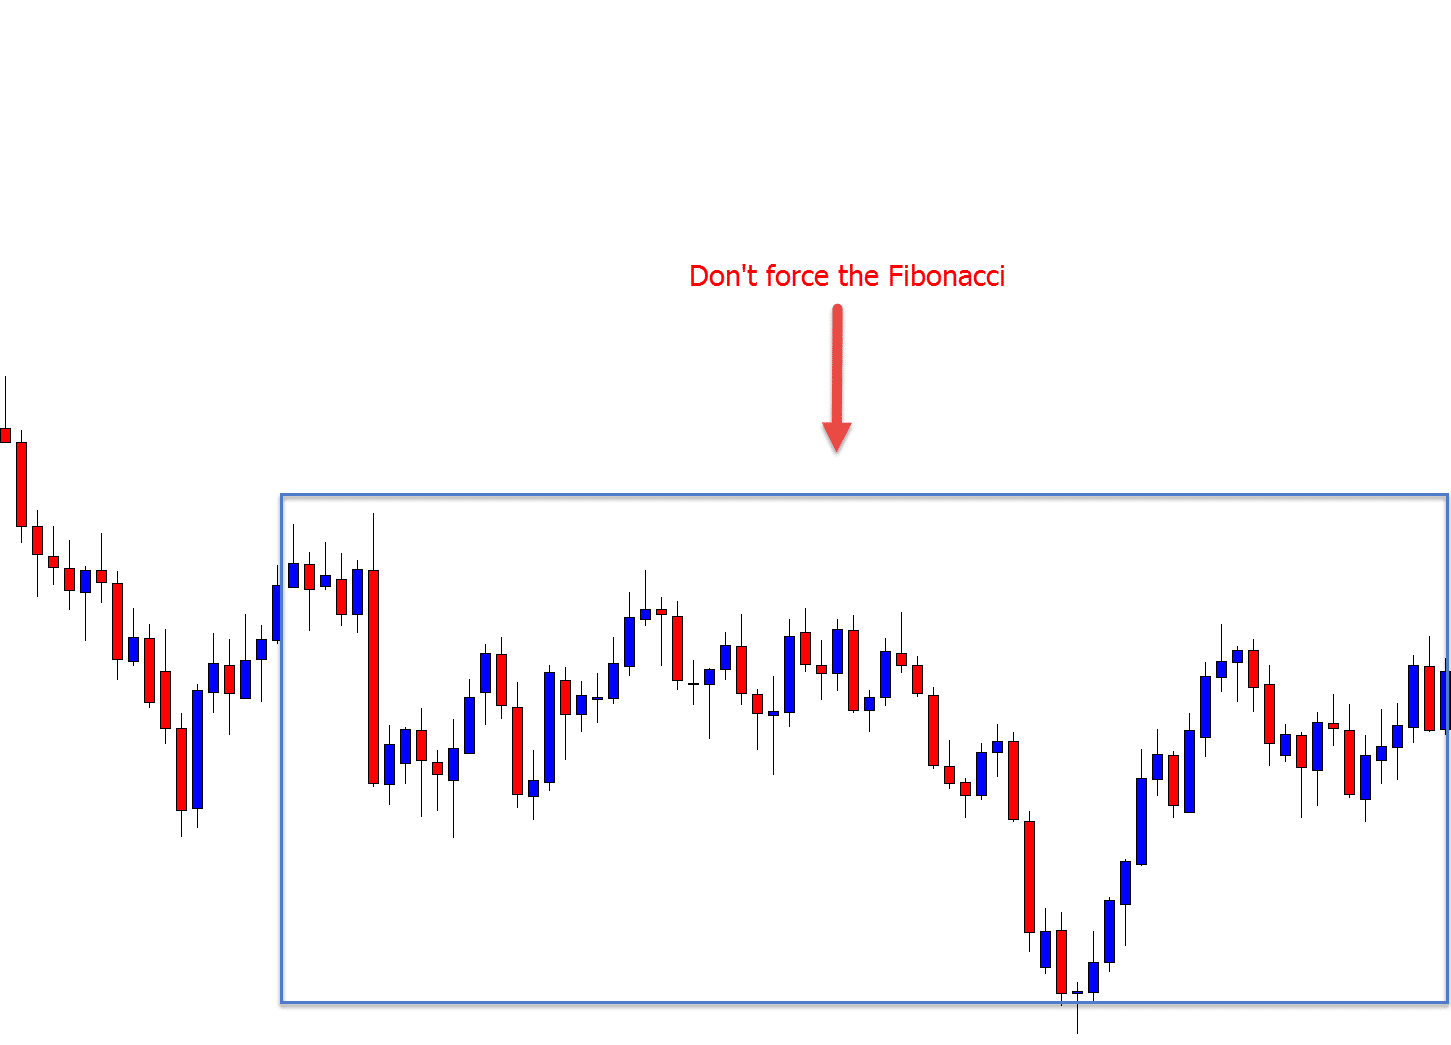
Below is an example of a sideways and ranging market showing price stuck in a box pattern. In this type of market we do not want to force the use of the Fibonacci tool.
When to Use the Fibonacci Tool?
The optimum time to use the Fibonacci retracement strategy is when we have spotted a clear trend in the market.
We can always expect the trend to reverse and rotate back into value at some point in time. NO Market continues straight higher or lower without a break or pull-back into value.
We only want to be using Fibonacci when;
- There is a clear short or medium term trend.
- We have a logical pullback in that trend.
- The key Fibonacci levels line up with other support and resistance.
Examples of Using Fibonacci Retracement Trading Strategy Forex
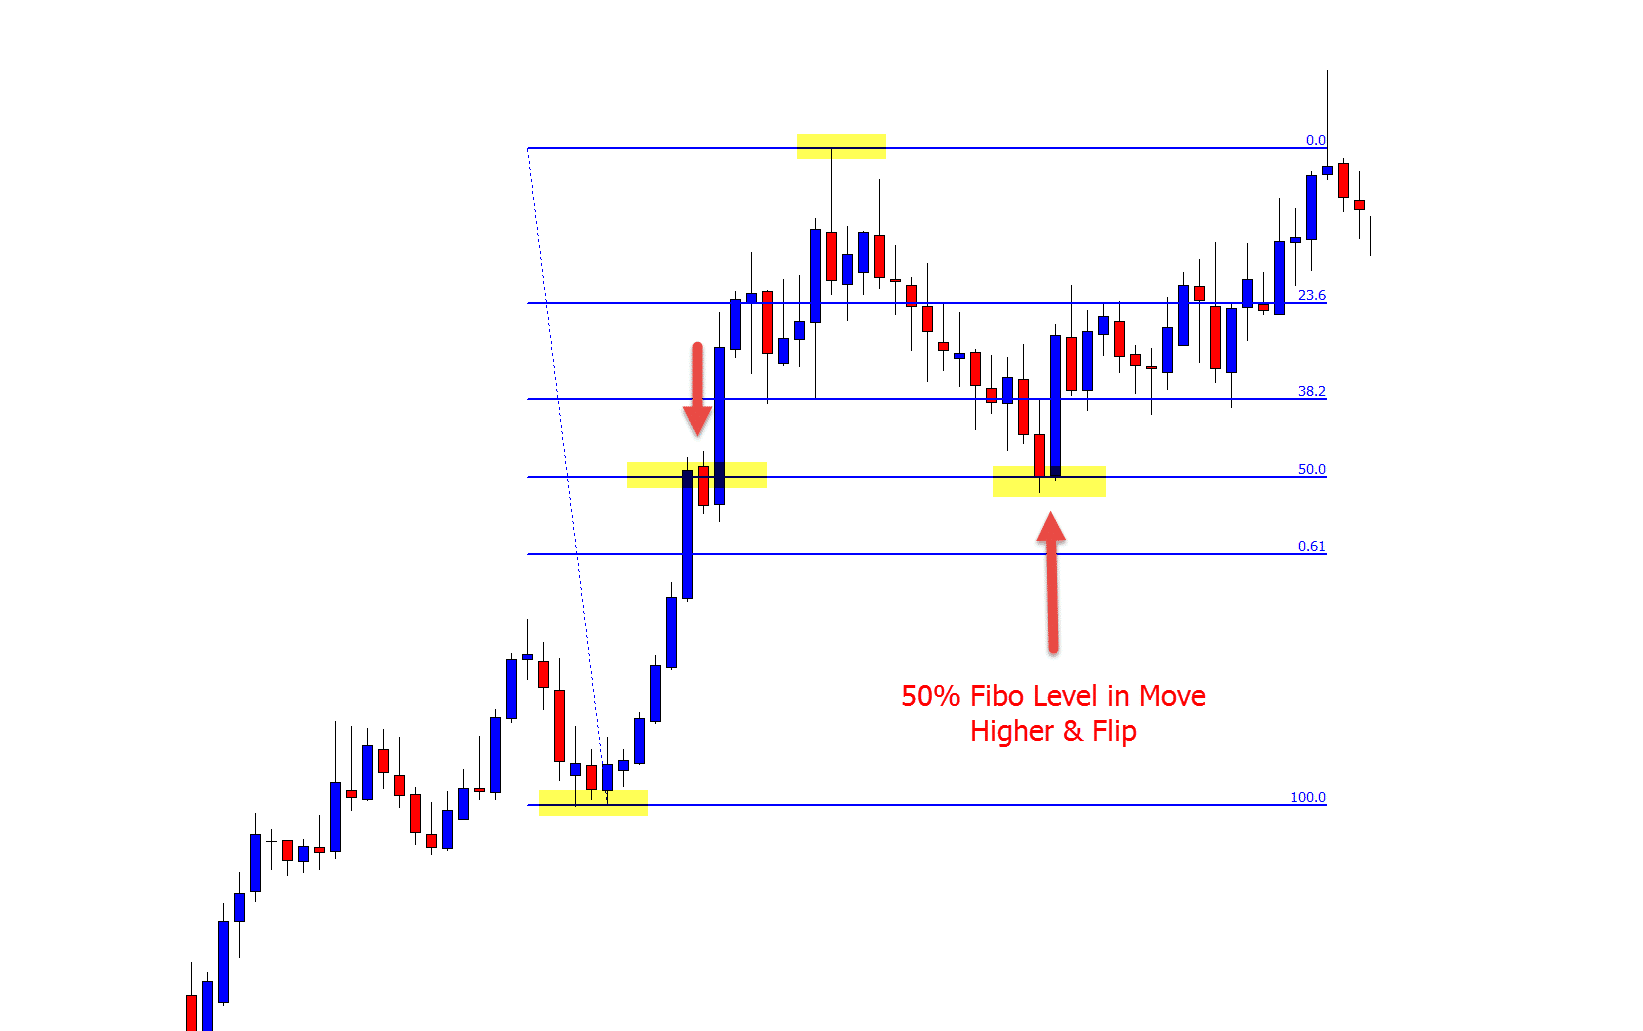
Example #1 in Uptrend:
For the uptrend we place the Fibonacci from the extreme low to the high. Notice how price retraced in the uptrend and touched the 50% level before again going higher with the trend.
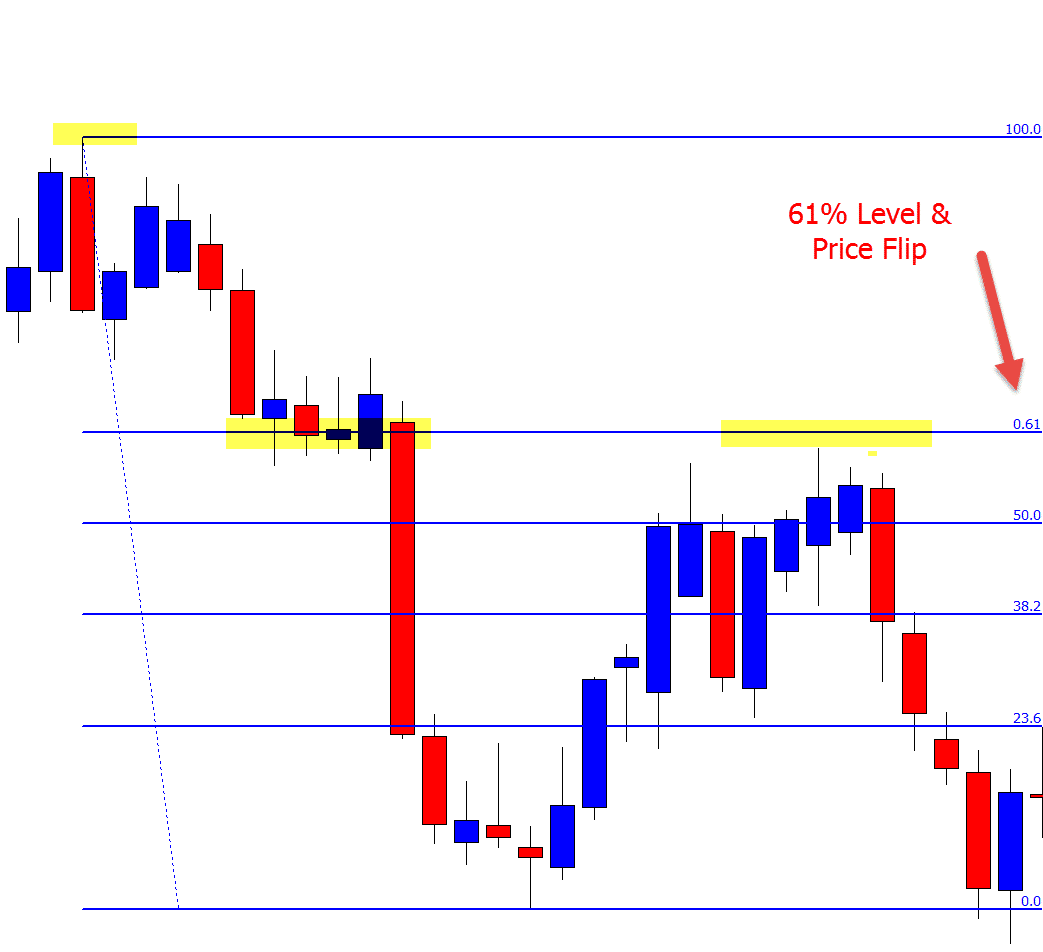
Example #2 in Down Trend:
For the down trend we place the Fibonacci tool from the high to the low. We then plot the 50% and 61.8% levels and watch how price reacts. In the chart below price respected the 50% level and could not move solidly above it. Price ended up continuing with the trend lower.
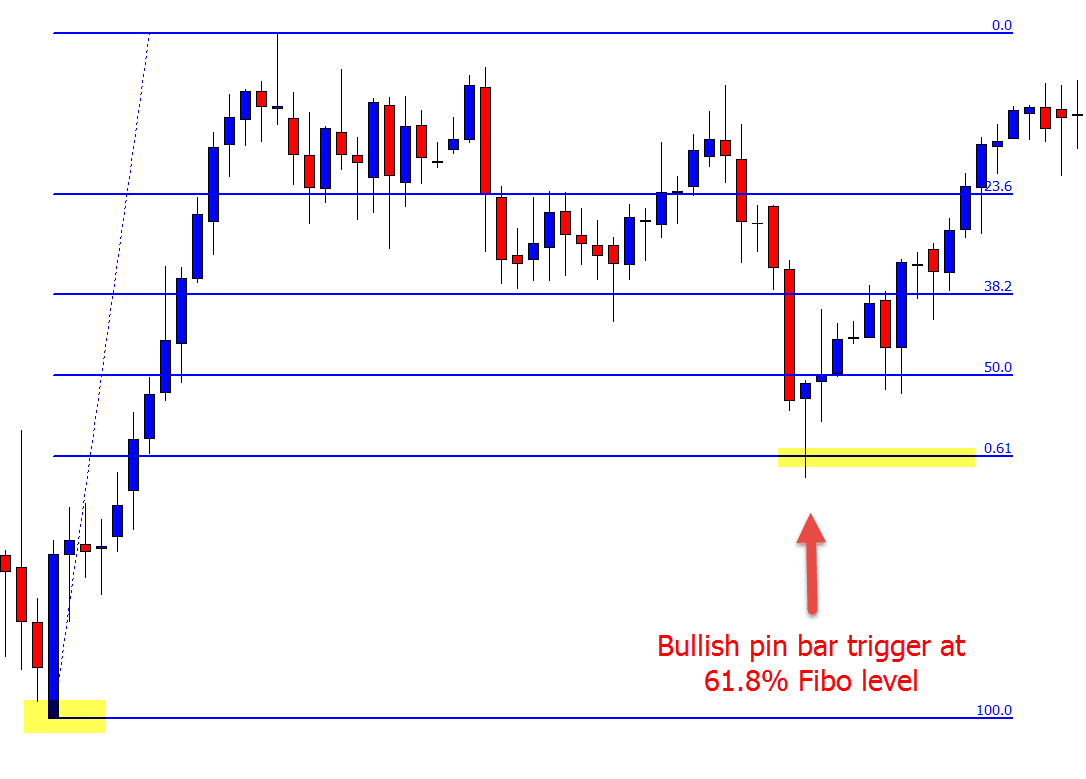
Example #3 Use Fibonacci With Price Action Trigger Signal:
In this example we see a pin bar form at a resistance level and at the 61% Fibonacci level. This is the sort of trade we need to look for and also the type of obvious levels and trends we need to use the Fibonacci tool with.
Checkout three previous ‘Charts in Focus’ posts using the Fibonacci level and how it can be used in real time;
- EURUSD Pull-back Into Price Flip & 4 Hour Fibonacci
- GBPNZD Moves Into 50% Fibonacci Level Within Strong Trend
- GBPCHF Pin Bar at Fibonacci & Big Round Number
Finally and Importantly
Fibonacci can be a useful trading tool when we don’t overdo it.
There are more advanced methods of using the Fibonacci beyond the scope of this lesson that we teach advanced students, such as shortening stop losses for bigger potential profits when certain criteria are met, but first understanding the basics are crucial.
We are not going to look for Fibonacci levels in every market or trade. We only use the tool in the most obvious trends and pullback areas and when we can stack the odds in our favor. I hope you have enjoyed this article and can implement this strategy into your trading.
Leave any comments or questions below in the comments section.
Safe Trading,
Johnathon

Good one Johnna, please which is the best time frame or chart for Fibonacci plotting
Sir Jonathan thank u very much, i was using Fibo in every trades now i can understand.
Hi Robert,
yes, smaller time frames can be used and the way this is done can best be explained through the following lessons (as would take a far longer comment);
https://www.forexschoolonline.com//trading-daily-chart-price-action-strategies-down-to-intraday/
https://www.forexschoolonline.com//ultimate-guide-marking-support-resistance-price-action-charts/
They explain timeframes and how to use each – let me know if any questions,
Johnathon
Excellent description of fibonacci, esecially describing market conditions that do not suit it.
What I would like your thoughts on is second time-frame involvement as an entry filter. I don’t believe the often mentioned 200 moving average actually works. Fibonacci Trader software specializes in this.
Also, channels. Donchian and bollinger work well with pin bar penetrations.