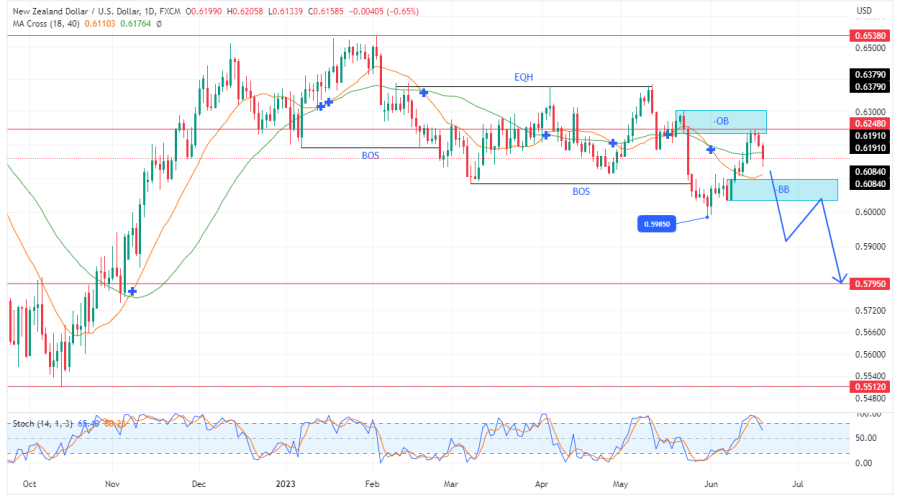
NZDUSD Analysis: NZDUSD Continues Its Downtrend As Price Hits Major Resistance At $0.62480 NZDUSD continues its downtrend as the price hits major resistance at $0.62480. The main direction of the market has been to the downside since February 2023. As far back as the last quarter of 2022, the price …
Price Action Charts in Focus
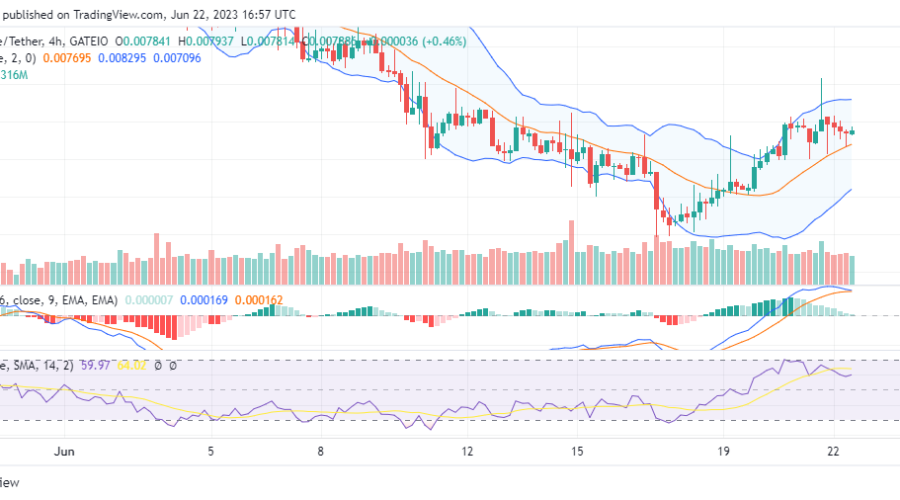
Dash 2 Trade (D2T/USD) Is Ready to Claim the $0.008 Resistance Price Level
Dash 2 Trade turned around at the $0.00659 price level on June 17, and since then it has gained steady traction despite the presence of bears in the market. However, at the $0.008 price level, the market faced strong resistance. The increased level of volatility in the market currently is …
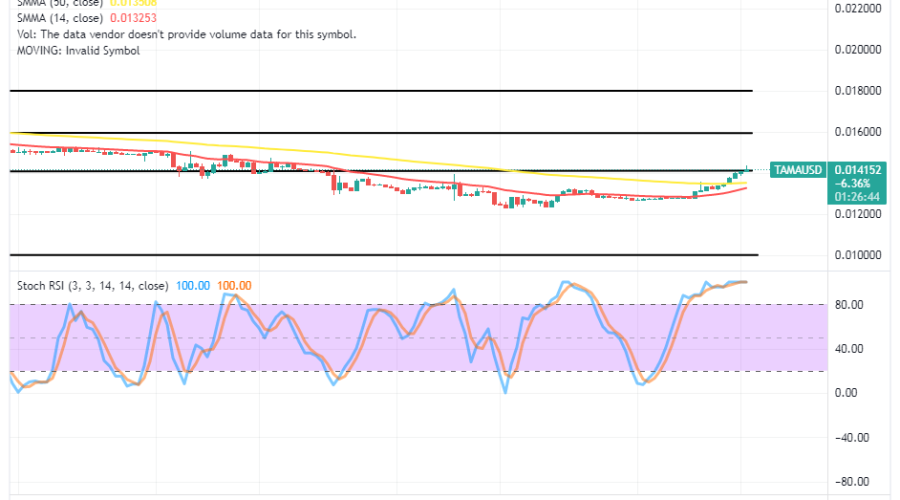
Tamadoge (TAMA/USD) Market Is Swinging High, Striving for More
Tamadoge Price Prediction – June 22The TAMA/USD market is swinging high, striving for more as transaction operations have taken on a new dimension.In the meantime, a sizeable degree of positivity has been recorded in the cryptocurrency’s valuation against the US currency between the $0.01400 and …
