• Skip to primary navigation
  • Skip to main content
  • Skip to primary sidebar
  • Skip to footer

ForexSchoolOnline.com

Learn to Trade Forex Online

  • Compare Brokers
    • Broker Type
      • Paypal Brokers
      • Swap-Free Brokers
      • Low Spread Brokers
      • ECN / STP Brokers
      • Market Maker Brokers
      • Non Dealing Desk Brokers
      • Low Minimum Deposit Brokers
    • Country
      • Brokers for Australia
      • Brokers for South Africa
      • Brokers for the UK
      • Brokers for the US
      • Brokers for Nigeria
    • Regulation
      • FCA Regulated Brokers
      • ASIC Regulated Brokers
      • FSCA Regulated Brokers
      • CFTC Regulated Brokers
    • Platform
      • MT4 Brokers
      • MT5 Forex Brokers
    • Strategies
      • Hedging Forex Brokers
      • Scalping Forex Brokers
      • Carry Trade Forex Brokers
      • Brokers for Indicators and EA’s
  • Start Here
    • Start Trading Guide
    • Beginner Trading Lessons
  • Free Forex Course
    • Public Login
    • Register
    • Password recovery
  • Lessons
    • Strategies
    • Videos
    • MT4 Guides
    • Money Management
  • Trade Setups
  • Tools
    • Correct Free Demo Charts
    • Forex Journal Download
    • Position Size Calculator
    • FULL List of Tools
    • Forex Demo Accounts
  • Price Action Guide
  • Free Course

How to Find and Trade the Rounding Bottom Chart Pattern

Johnathon Fox
09/16/2020 | UPDATED ON: 09/16/2020

What is a Rounding Bottom Chart Pattern?

The rounding bottom chart pattern is known as a bullish reversal pattern.

After moving lower in a downtrend price will form a series of movements that when created look like a ‘U’ shape.

The rounding bottom can be spotted and traded in many different markets and time frames and you can use it to not only find trades, but also help you set your profit targets.


How a Rounding Bottom Pattern Works

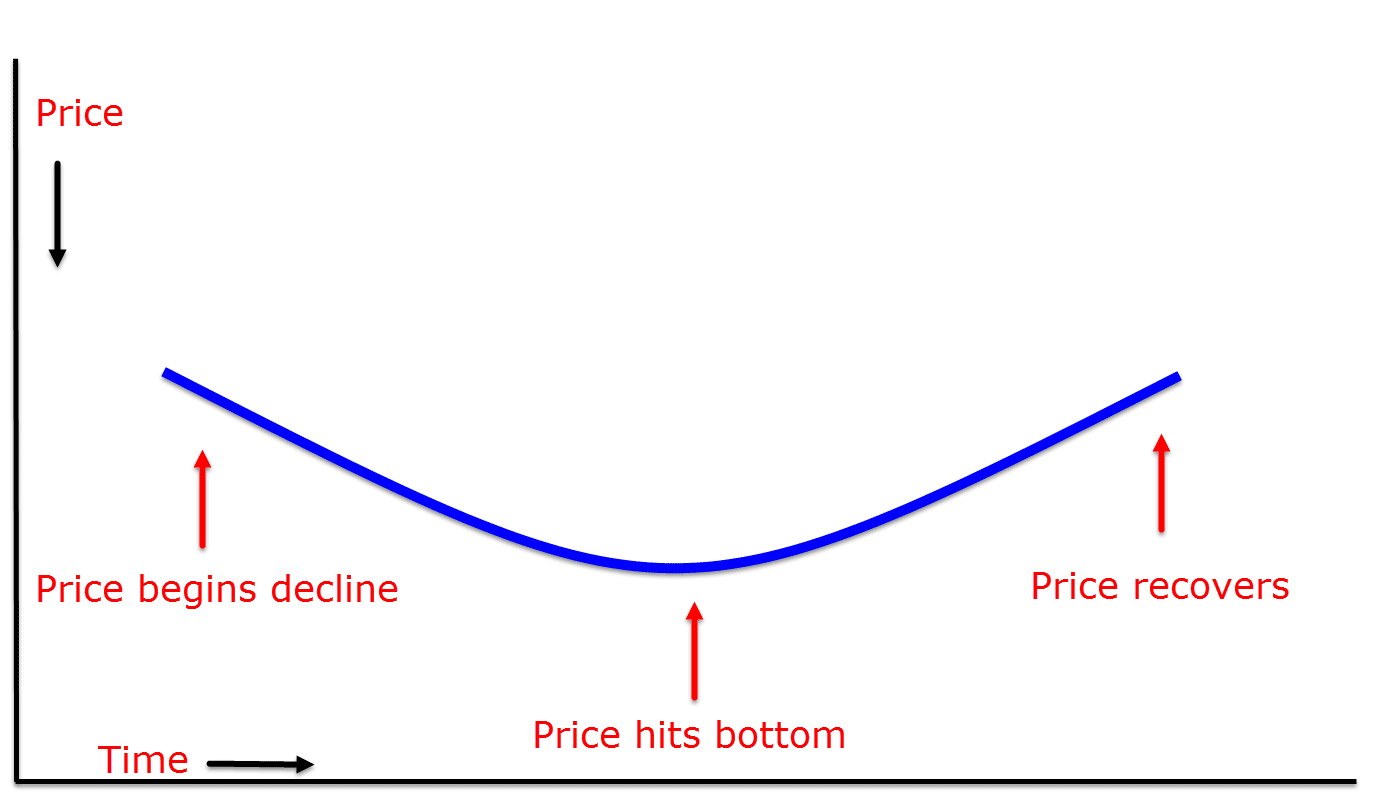
A rounding bottom pattern is a pattern showing price has ‘bottomed’ out and the recent trend lower has come to an end for the time being.

As the example below shows; price is first trending lower. Price then moves into the bottom phase. During this phase it is very common for price to move sideways or consolidate for a period.

Price will then breakout of the consolidation and make a move higher.

Once the neckline of the rounding bottom pattern is broken the pattern is complete.

Whilst the rounding bottom pattern can be used on any time frame, the best time frames to identify and use this pattern are the higher time frames like the daily chart. 

The higher time frames can give you greater market clarity and also help you analyze potential trades for the smaller time frames like the 4 hour and 1 hour charts.

what is rounding bottom


Example of a Rounding Bottom

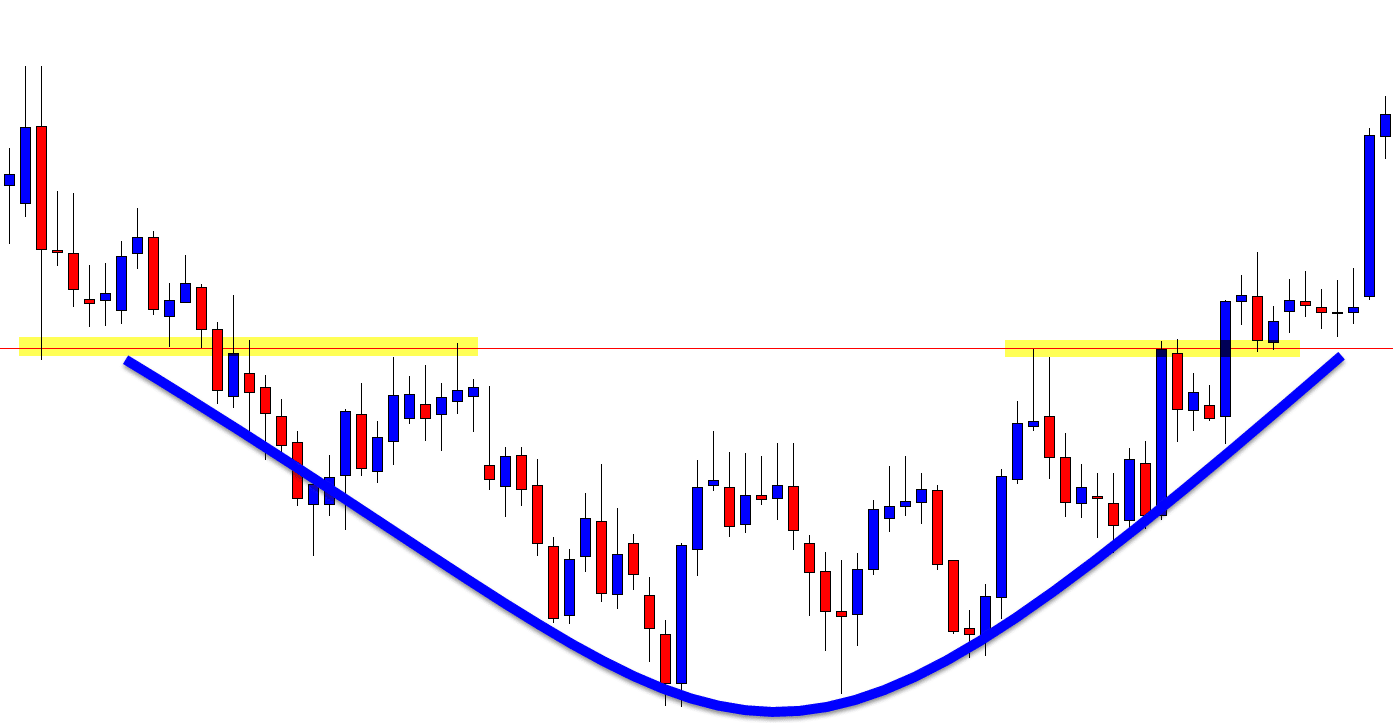
As the example price chart shows below; there is a clear neckline with the rounding bottom.

Once the neckline is broken with price moving higher the pattern is confirmed. This is also when we will see the largest and most explosive move of the pattern.

Breakout traders will be watching this pattern and looking to enter when the pattern confirms with the neckline breaking.

Rounding bottom

The best entries when trading this pattern are breakout trades when the neckline breaks.

Two ways you can do this are by either taking a straight aggressive breakout higher, or you could watch for price to first confirm the break and then enter.

Price will often breakout and then make a retest of the old breakout resistance and new support level. 

This can also give you a chance to make a re-entry if you missed the initial breakout trade.

The best way to find these entries is to first identify the rounding bottom pattern has formed and price has broken out higher.

Once you have noticed price rotating back lower to test the old resistance and new support level you can look for bullish price action trades.


How to Find Targets With the Rounding Bottom

Rounding bottom patterns are not just used to find potential entities, they can also be used to find accurate profit targets.

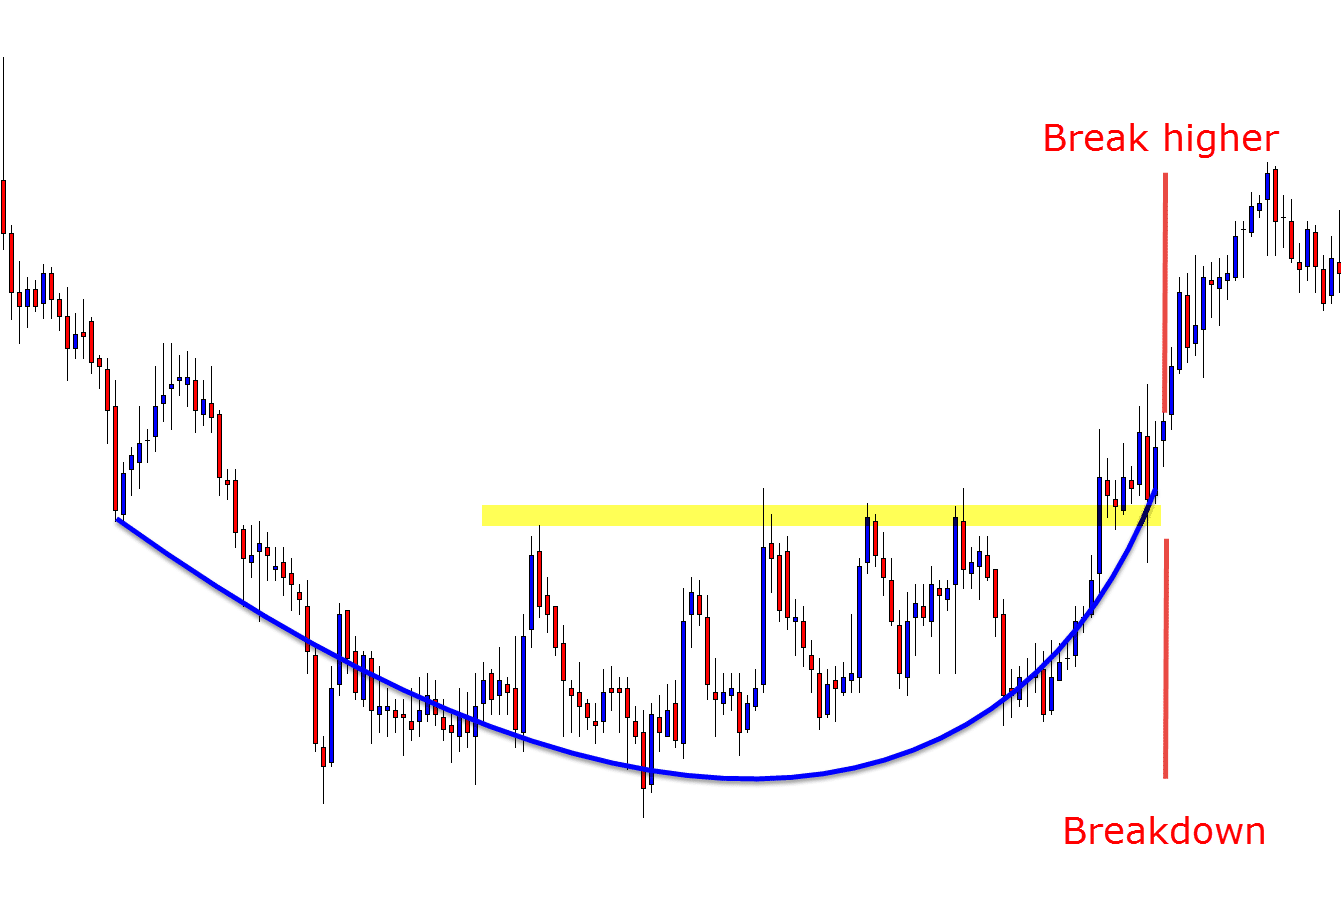
After breaking the neckline, price will normally move the same length higher that the initial breakdown moved lower.

For an example of this see the chart below; if price broke down from the neckline 250 pips, then we could expect the price to move 250 pips higher once it completes the pattern and breaks higher.

profit target rounding bottom

Keep in mind this is not a hard and fast rule, but a guideline.

You should still use other technical analysis and tools to help guide your profit targets. These include the major support or resistance levels or other major market factors.


Recommended Broker

  • Broker
  • Min Deposit
  • Benefits
  • Score
  • Visit Broker

$200

T&Cs Apply
  • The Lowest Trading Costs
  • 50% Welcome Bonus
  • Award-winning 24 Hour Support
5
Trade Now FreeBets Reviews
Reviews

About Johnathon Fox

Johnathon is a Forex and Futures trader with over ten years trading experience who also acts as a mentor and coach to thousands and has written for some of the biggest finance and trading sites in the world.

View all posts by Johnathon Fox →
Previous Post: « Zoom Market Cap Tops $100B, Shares Rally By 41% in One Day
Next Post: Fortnite Publisher Worth $17.3B Following Funding Round, Almost Three Times Major League Soccer »

Reader Interactions

Leave a Reply Cancel reply

Your email address will not be published. Required fields are marked *

Primary Sidebar

Forex School Online

High Probability Price Action Trading

How to make, manage and take profit from trades in the markets

Start Learning (It's Free!)

Turn Your Trades into Winners!

The Price action course is the in-depth advanced training on assessing, making and managing high probability price action trades.

Sign up for Free!

Recommended Broker

  • Broker
  • Min Deposit
  • Benefits
  • Score
  • Visit Broker

$200

T&Cs Apply
  • The Lowest Trading Costs
  • 50% Welcome Bonus
  • Award-winning 24 Hour Support
5
Trade Now FreeBets Reviews
Reviews

Footer

Get Our FREE Course, Bonus Strategies & Indicators!
X
Join Us Now!

Your capital is at risk.

X

CORNERSTONE LESSONS

Forex Trading for Beginners

Price Action Trading

How to Trade Forex

Technical Analysis

Forex Charts

Forex Trading Strategies

Money Management 

Compare Brokers

Best Forex Brokers

Forex Demo Accounts

Best Forex Trading Platforms

Forex Apps

Swap Fee Accounts

MT4 Brokers

CATEGORIES

Forex Videos

Trading Lessons

Weekly Trade Ideas

Start Here Guide

ForexSchoolOnline.com helps individual traders learn how to trade the Forex market

WARNING: The content on this site should not be considered investment advice and we are not authorised to provide investment advice. Nothing on this website is an endorsement or recommendation of a particular trading strategy or investment decision. The information on this website is general in nature so you must consider the information in light of your objectives, financial situation and needs.

Investing is speculative. When investing your capital is at risk. This site is not intended for use in jurisdictions in which the trading or investments described are prohibited and should only be used by such persons and in such ways as are legally permitted. Your investment may not qualify for investor protection in your country or state of residence, so please conduct your own due diligence or obtain advice where necessary. This website is free for you to use but we may receive a commission from the companies we feature on this site.

We Introduce people to the world of currency trading. and provide educational content to help them learn how to become profitable traders. we're also a community of traders that support each other on our daily trading journey

Forexschoolonline.com is not a financial advisor. Do your research before investing your funds in any financial asset or presented product or event. We are not responsible for your investing results.

Copyright © Forex School Online Sitemap  - Privacy Policy - Disclaimers & Terms of Use - CONTACT US