GBPCHF DAILY & 1 HOUR CHARTS
Inside bars are a bit of a theme on the charts at the moment and whilst they are a lot more common than other candlestick formations, they are forming quite a lot just at the present time.
The reason they are more common than for example a large engulfing bar, is because they are an indecision candle or a candle that is not showing strength either way. An engulfing bar is a reversal. It is showing that the market is trying to reverse from one direction to the other. The inside bar is showing that the bulls and bears are in a fight over control and at the moment no one has control just yet.
As we know, markets more often than not move in ranges and sideways movements. In others words; markets spend the bulk of their time without clear trends and without a clear dominant force. This is the larger overall view, but on the candle by candle basis, this is basically what the inside bar is doing and why we often get so many of them.
You can read about how the inside bar can be best read and deployed in your trading in the lesson;
Using the Price Action Inside Bar
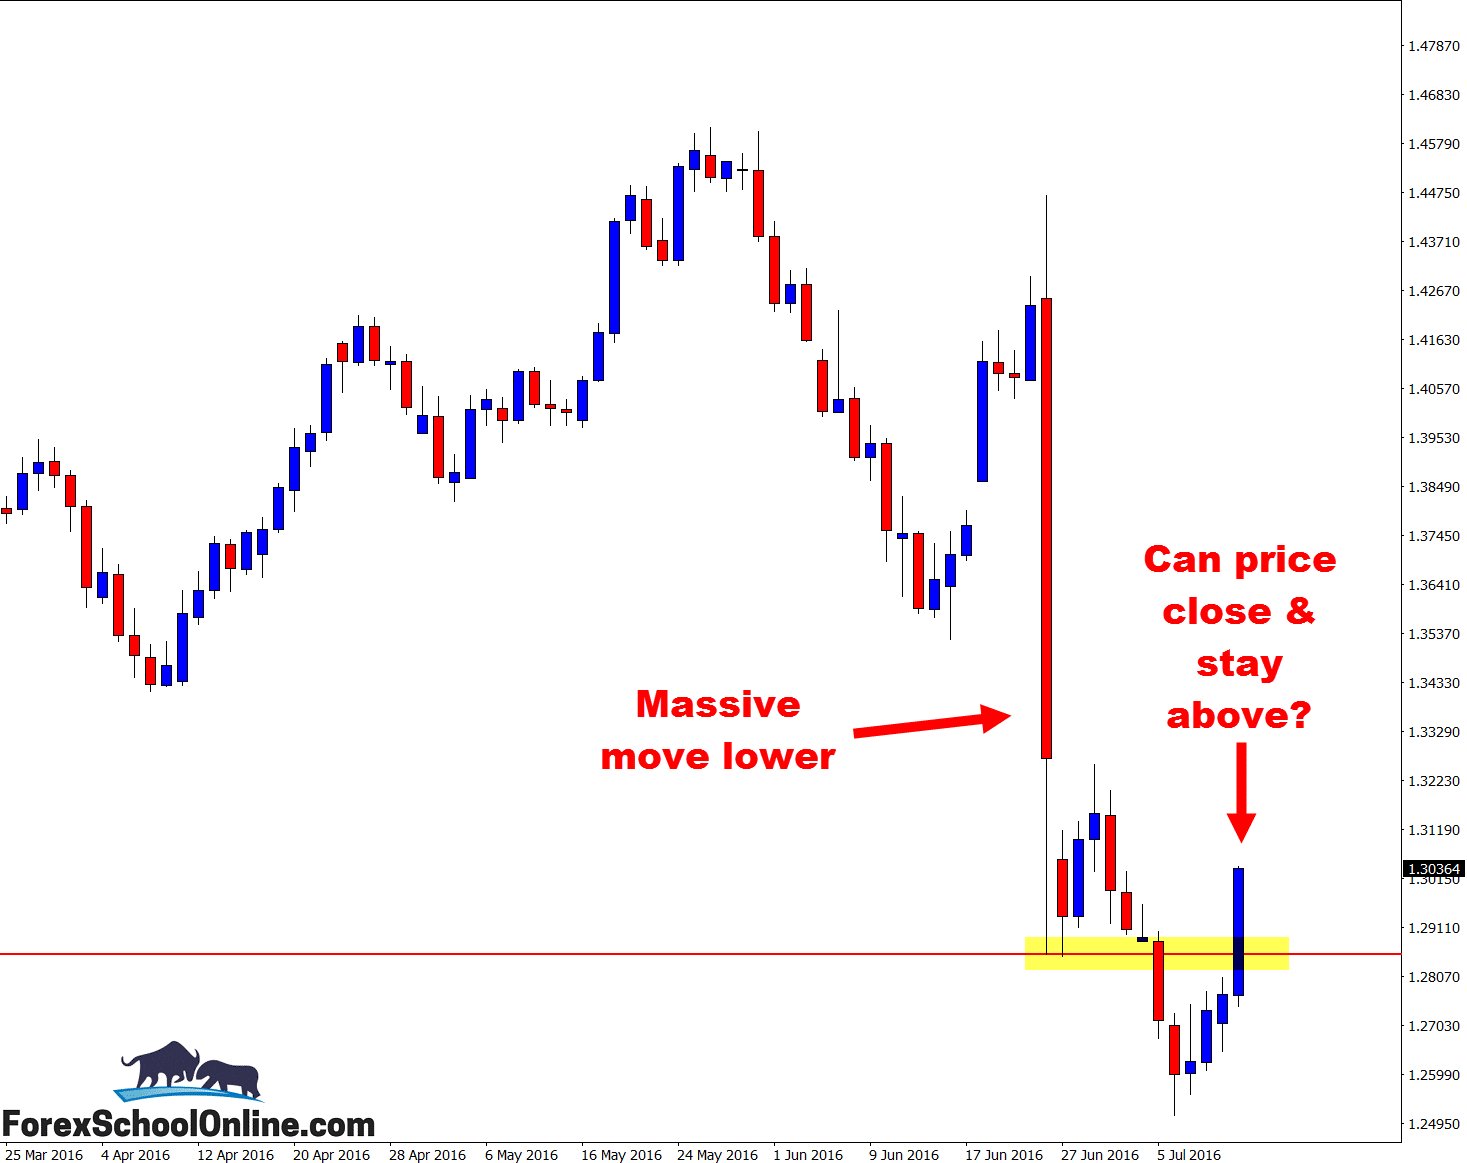
This being a GBPound pair has been smashed over the last two weeks or so on the back of the UK leaving the Euro. As you can see on the daily chart of this pair however; we are getting a heck of a rebound on the daily chart as I write up this Weekly Chart in Focus for you.
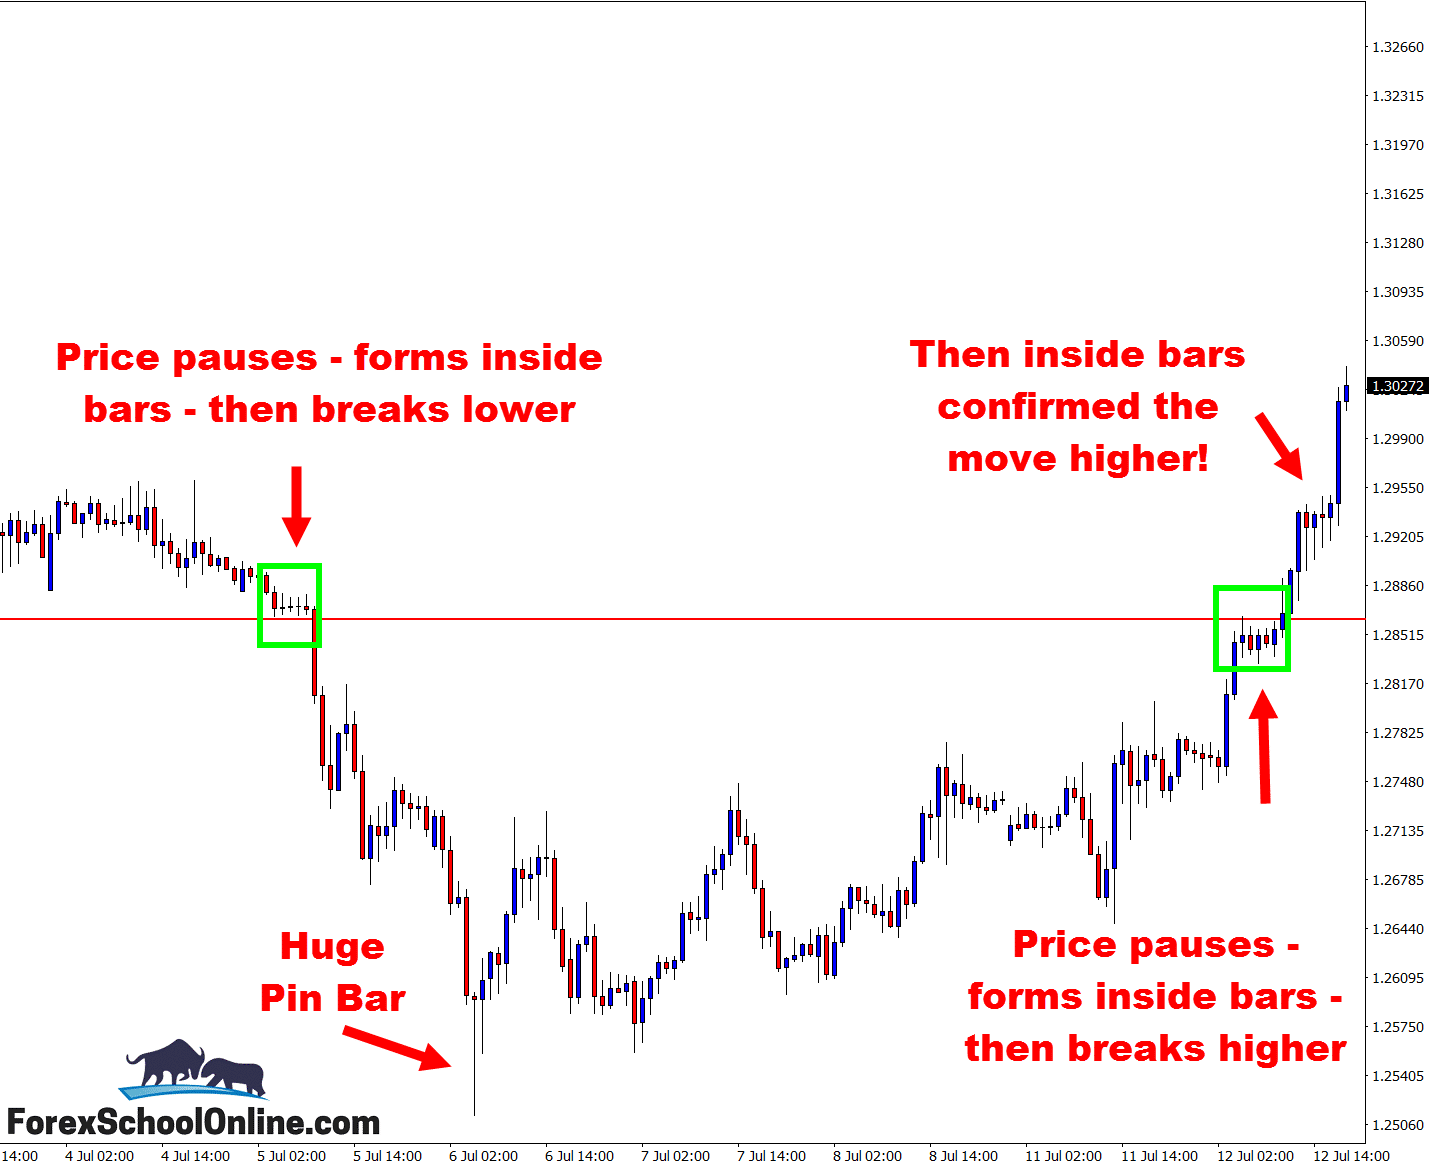
The 1 hour chart is where I want to concentrate my attention on this pair because of the inside bars and the story they created in this market. As price was moving lower, you can see that price paused and in doing so began to move sideways with a series of inside bars. This is a very common consolidation pattern.
After price smashed this level lower we had the large bullish pin bar at the extreme low that sent price into the consolidation that I have highlighted once again. You will see another series of inside bars, this time underneath the major level.
Notice with all three inside bar examples; price is pausing, then exploding to continue? The inside bar can be used as a reversal, but it is super tricky. As I said at the top of this post; because the inside bar is an indecision setup it is not showing a clear sign of direction either way like a reversal.
Daily GBPCHF Chart
1 Hour GBPCHF Chart
EURJPY DAILY & 4 HOUR CHARTS
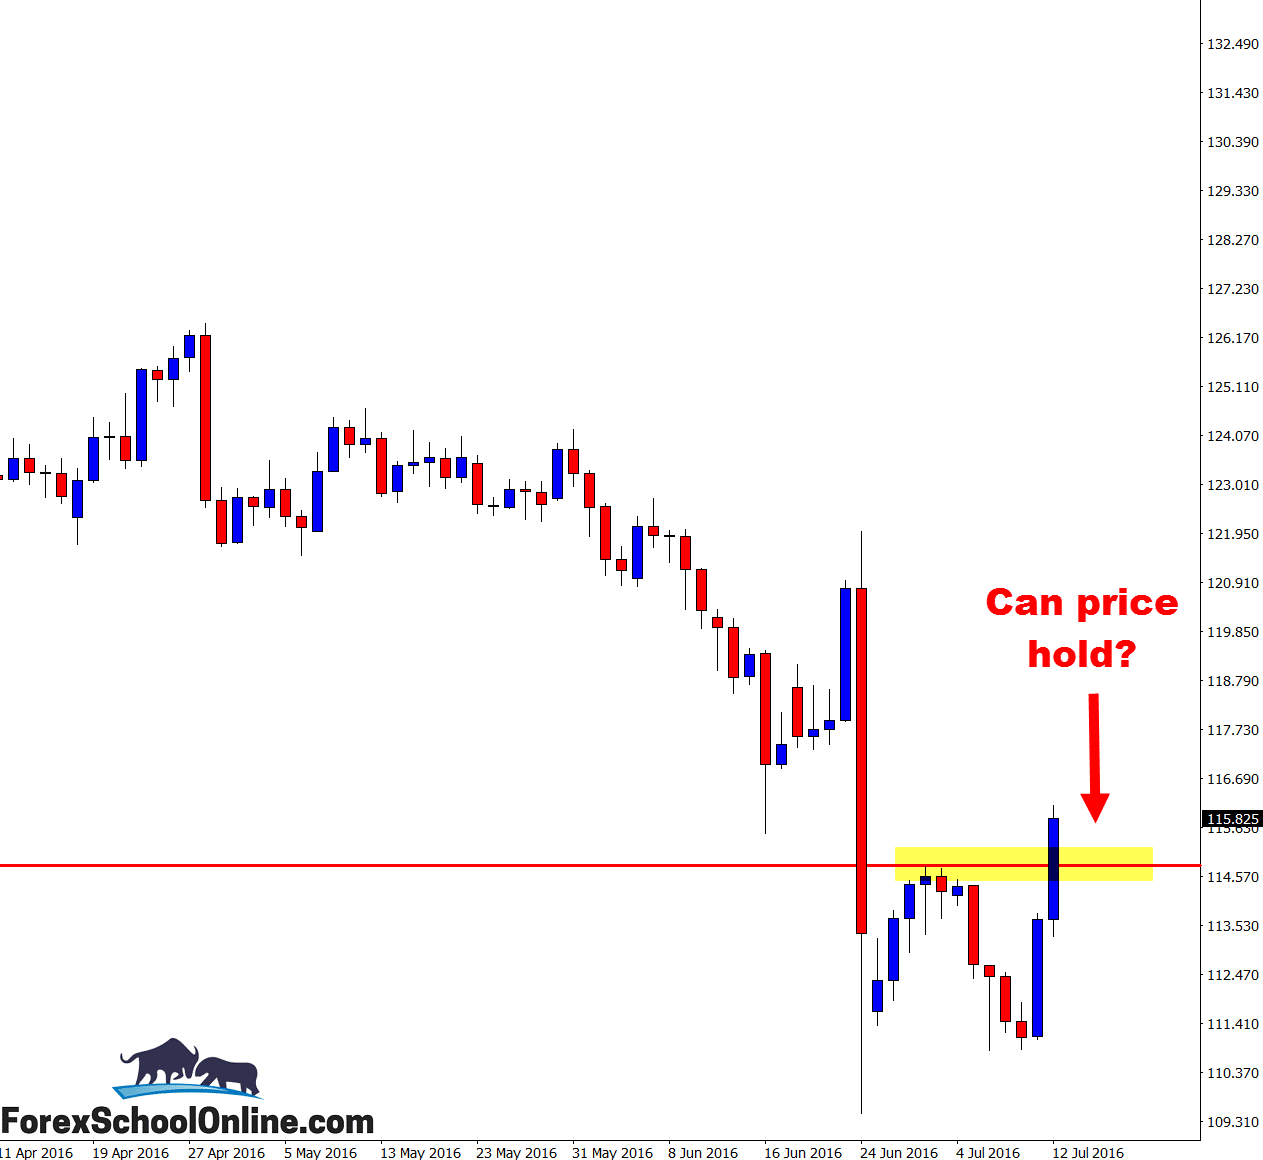
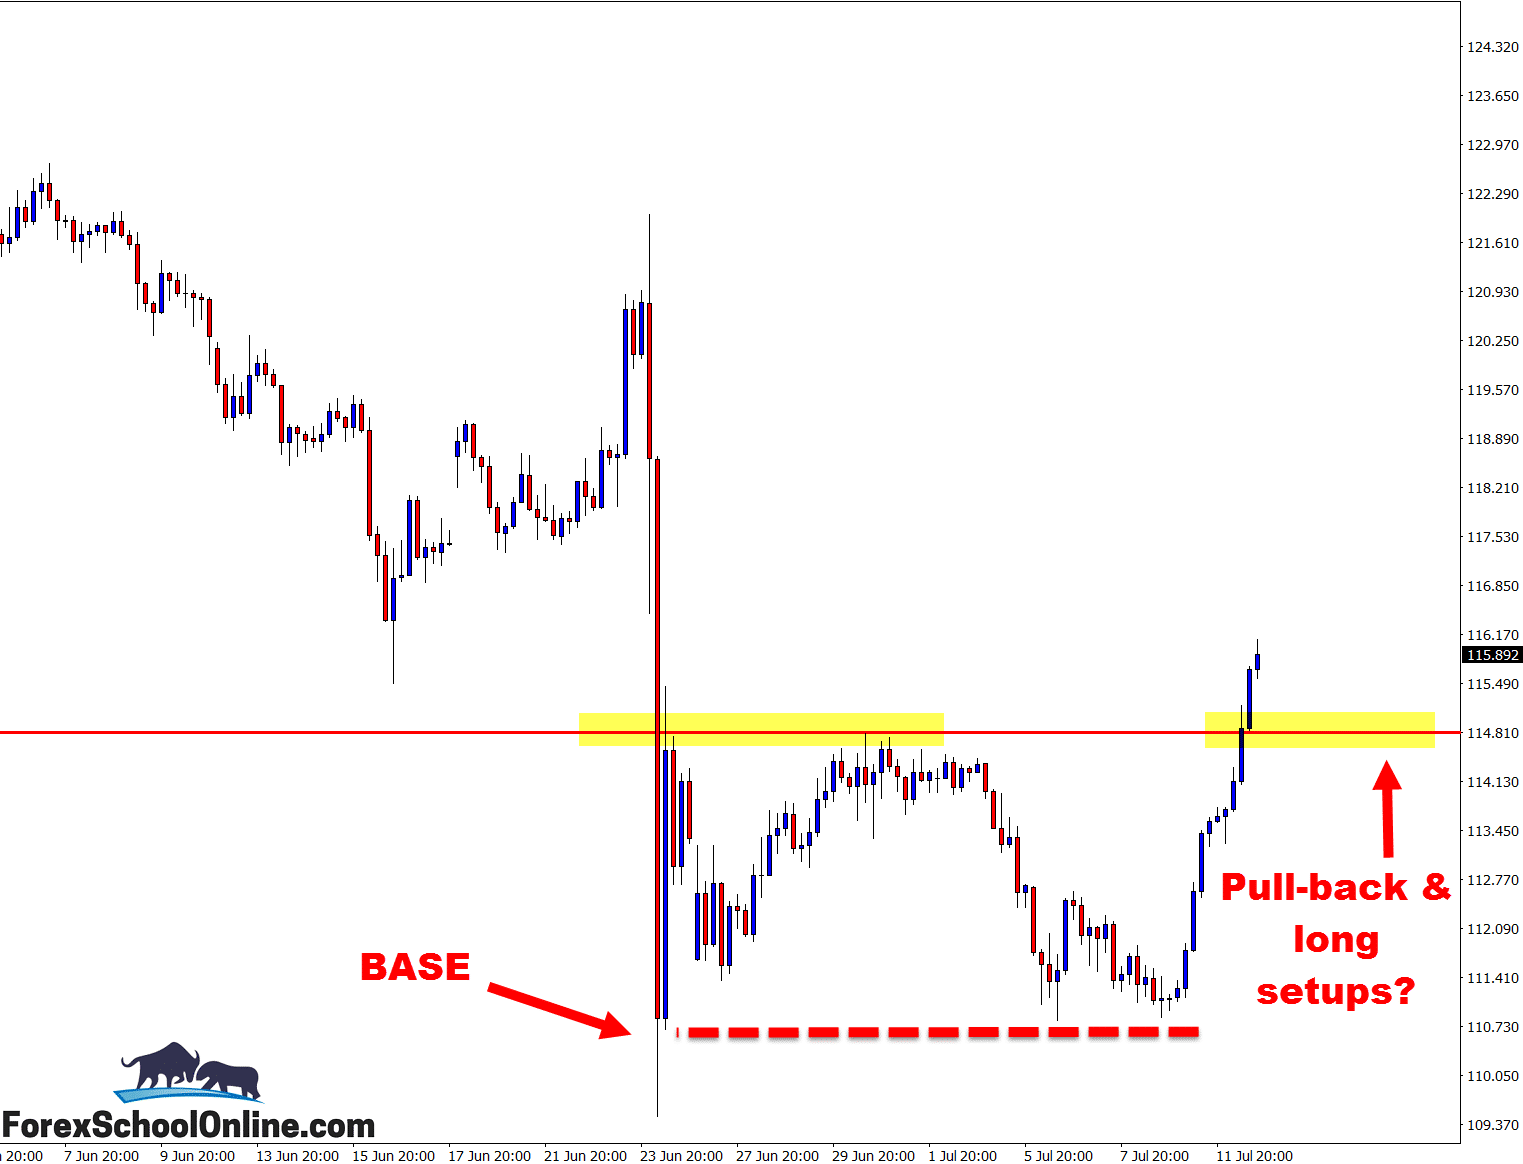
On the daily chart of the EURJPY we can see price has made a double low with the recent second test of the major support level. The first test was the candle low of the massive engulfing bar that was formed after the BREXIT news announcement. After making the quick retracement back into the overhead resistance, price made the double low and test of the support, now cracking higher and through the resistance level.
Now comes the major test. Can price make a close and stay above this level in the next sessions or will it fall back through with the weight of fresh selling?
Aggressive traders could move to their intraday charts such as their 4/2/1 hour charts or even smaller time frames and look for moves and pull-backs into the new price flip support to get long should price make a quick re-test over the coming sessions.
Daily EURJPY Chart
1 Hour EURJPY Chart
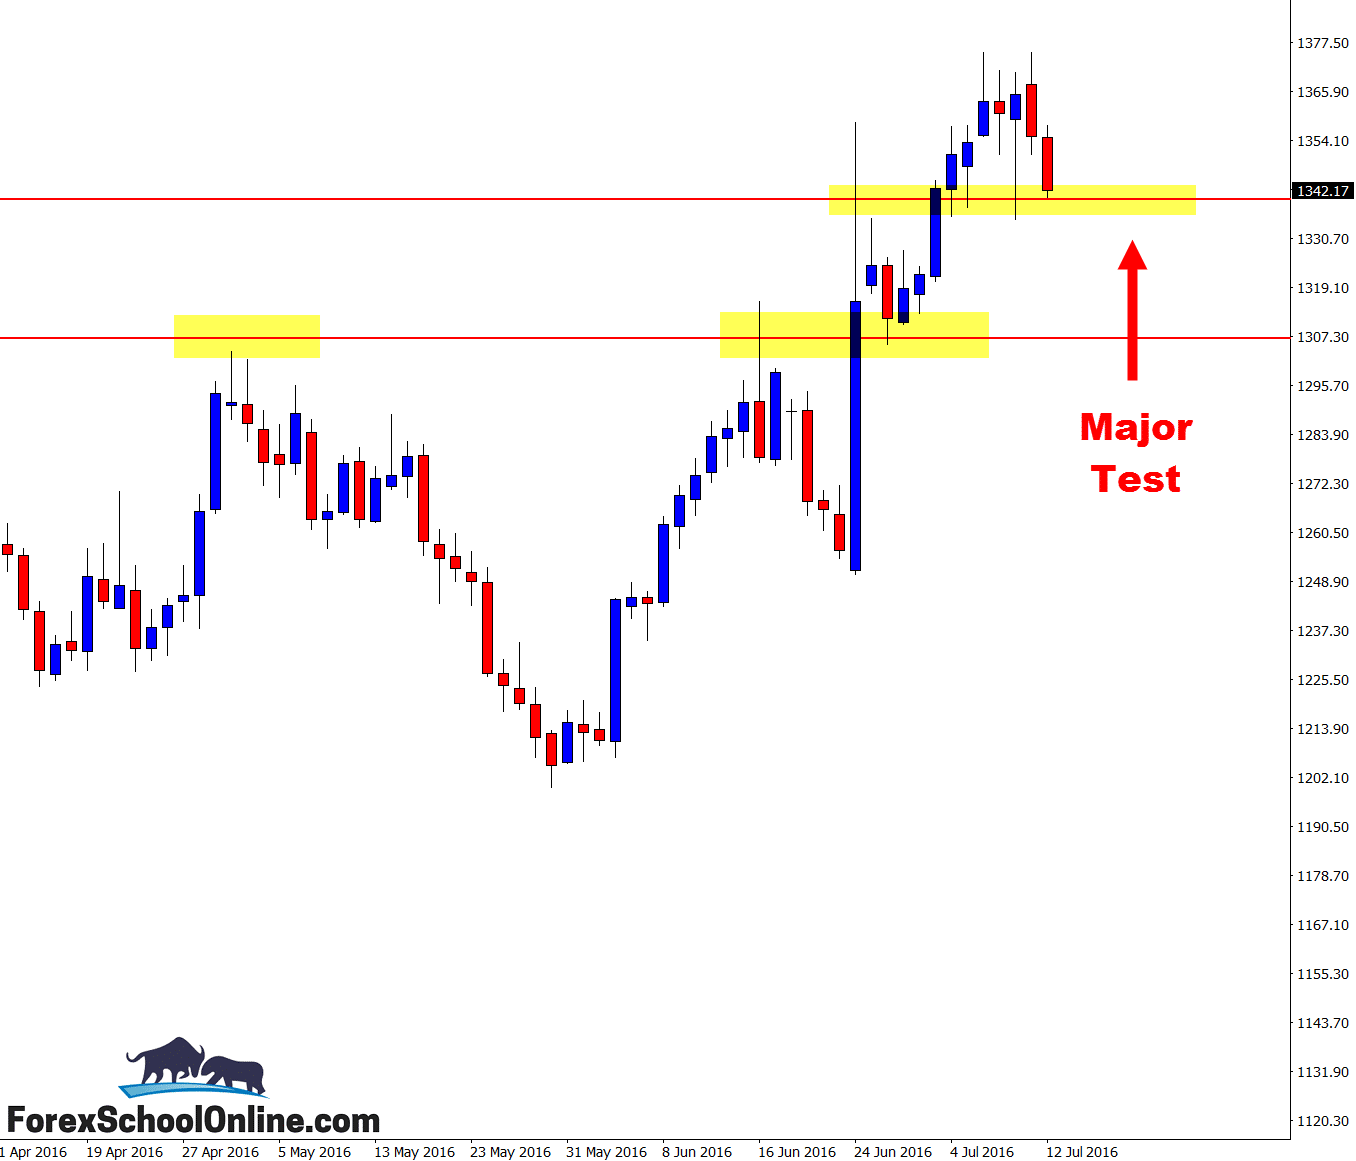
GOLD DAILY CHART
At the time of writing this post for you price is making a really key test of the major daily support level on the Gold chart that could be crucial for where price goes over the coming sessions.
Over the last few weeks price has been moving strongly higher with a series of higher highs and higher lows. The best play in recent times has been to look for long trades with this strong momentum higher.
If price breaches this current support level and makes a move lower, the next major support to start looking for comes in around the 1305.50 area. This area is a proven price flip level that has acted as both a major support and resistance level.
Any move below this and we are moving back into a lot of traffic and back into a lot of sideways territory where we have just come from which you would really need to keep your eye on and be super cautious of.
Daily Gold Chart
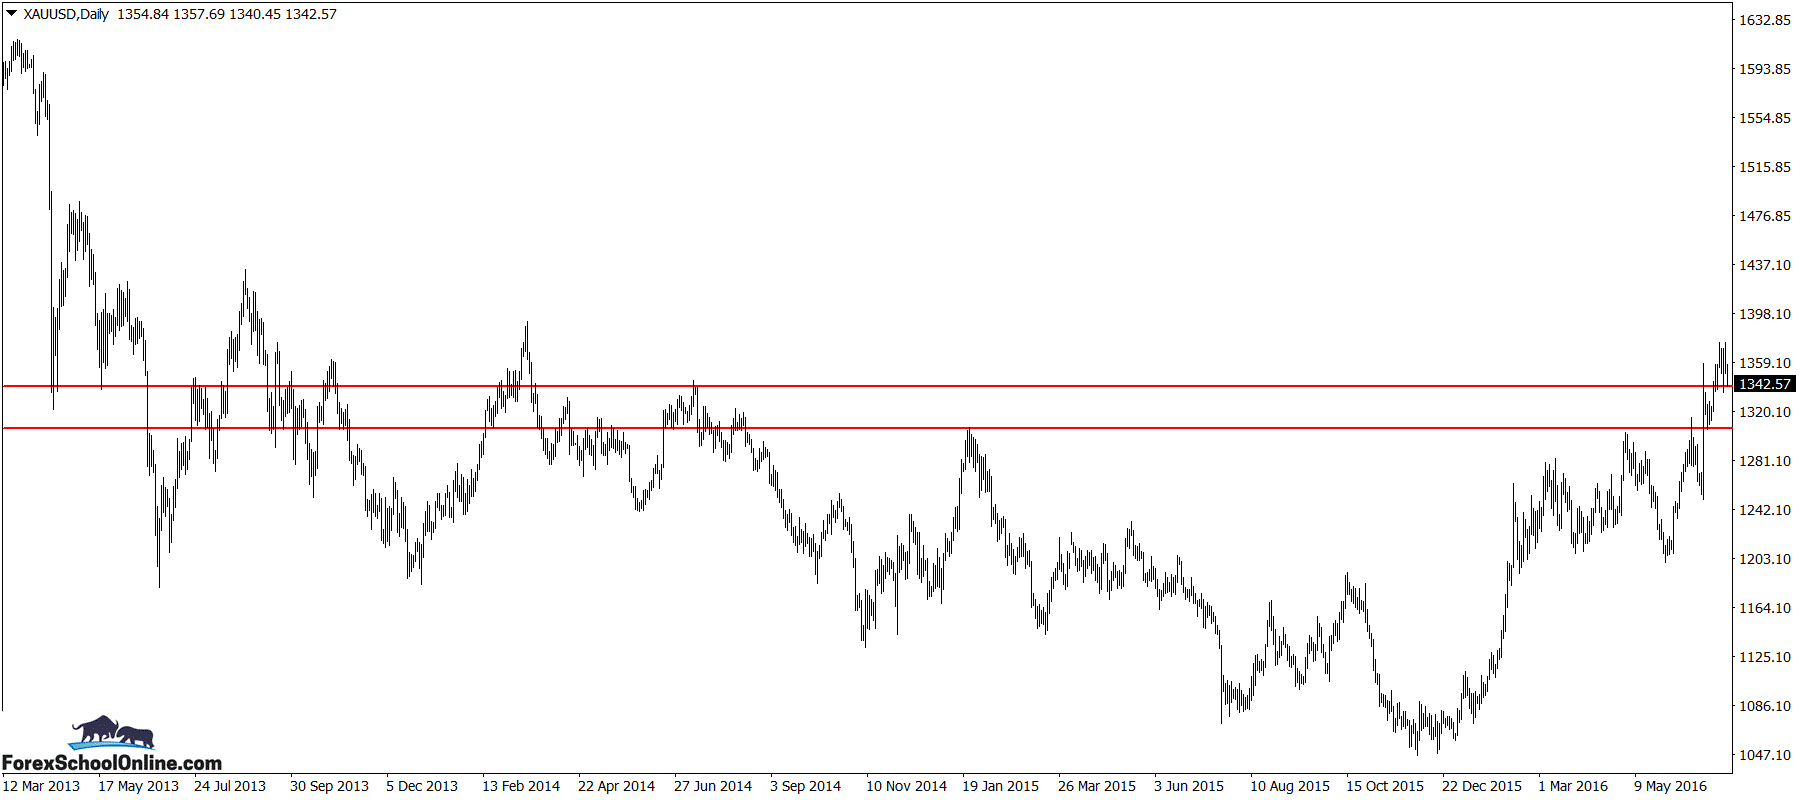
Daily Gold Chart – Zoomed Out
Special Note: If you have not yet watched my new video lesson on Crushing Fears & How to Hunt Trades in Markets that are Making Super Fast Volatile Moves, then check it out at;
Crushing Fears & How to Hunt Trades in Markets that are Making Super Fast Volatile Moves

Leave a Reply