• Skip to primary navigation
  • Skip to main content
  • Skip to primary sidebar
  • Skip to footer

ForexSchoolOnline.com

Learn to Trade Forex Online

  • Compare Brokers
    • Broker Type
      • Paypal Brokers
      • Swap-Free Brokers
      • Low Spread Brokers
      • ECN / STP Brokers
      • Market Maker Brokers
      • Non Dealing Desk Brokers
      • Low Minimum Deposit Brokers
    • Country
      • Brokers for Australia
      • Brokers for South Africa
      • Brokers for the UK
      • Brokers for the US
      • Brokers for Nigeria
    • Regulation
      • FCA Regulated Brokers
      • ASIC Regulated Brokers
      • FSCA Regulated Brokers
      • CFTC Regulated Brokers
    • Platform
      • MT4 Brokers
      • MT5 Forex Brokers
    • Strategies
      • Hedging Forex Brokers
      • Scalping Forex Brokers
      • Carry Trade Forex Brokers
      • Brokers for Indicators and EA’s
  • Start Here
    • Start Trading Guide
    • Beginner Trading Lessons
  • Free Forex Course
    • Public Login
    • Register
    • Password recovery
  • Lessons
    • Strategies
    • Videos
    • MT4 Guides
    • Money Management
  • Trade Setups
  • Tools
    • Correct Free Demo Charts
    • Forex Journal Download
    • Position Size Calculator
    • FULL List of Tools
    • Forex Demo Accounts
  • Price Action Guide
  • Free Course

NZDCAD Flies Through Key Resistance For Potential Re-test Trade Setup | 23rd July 2015

Johnathon Fox
07/24/2015 | UPDATED ON: 08/05/2019

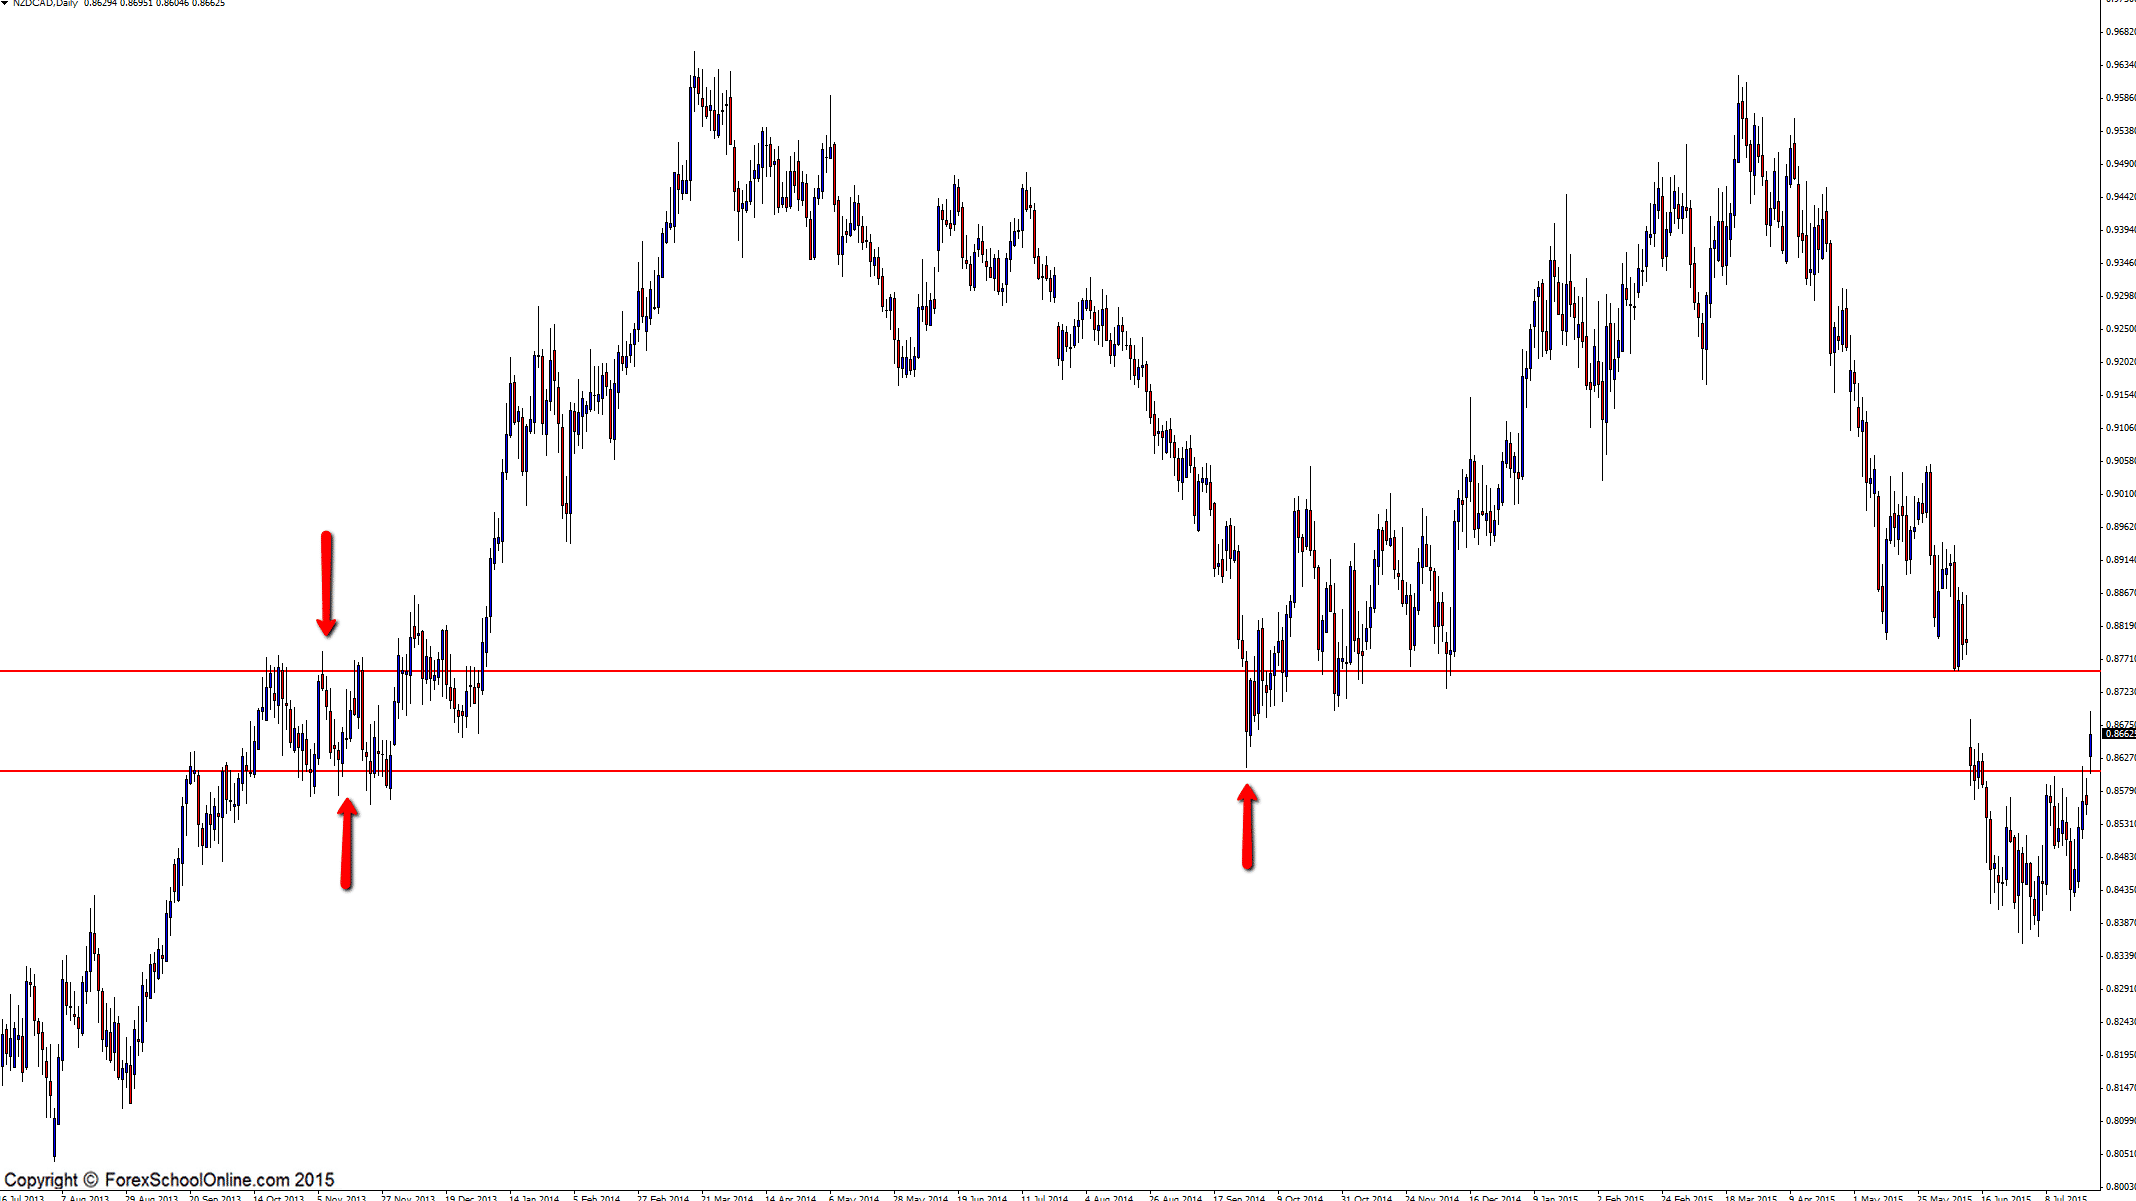
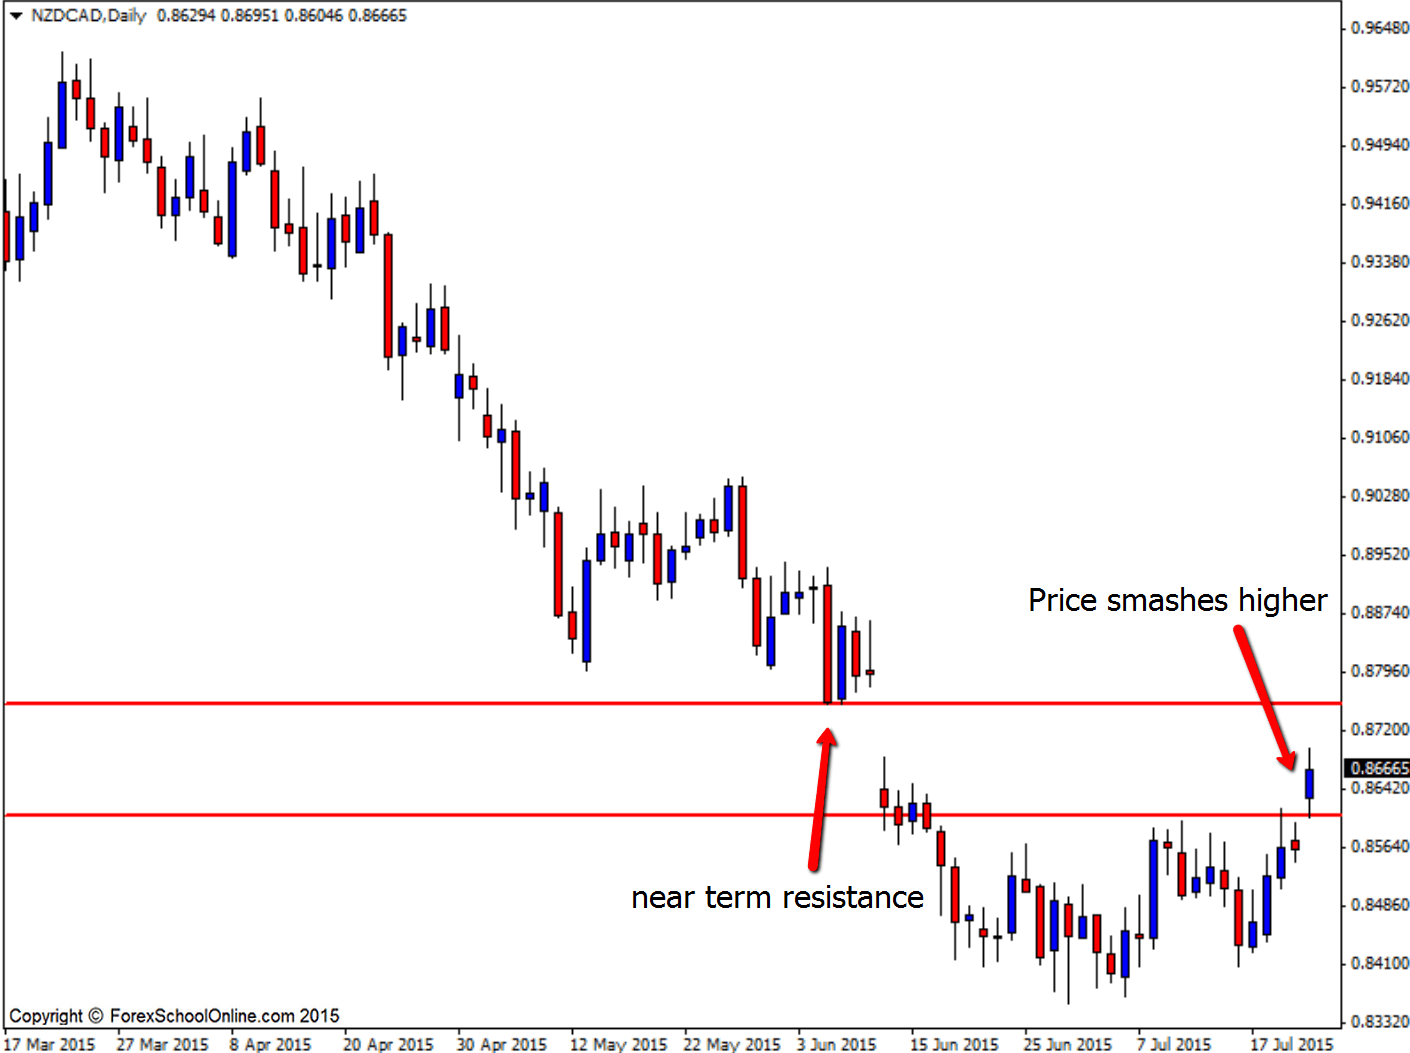
The NZDCAD has flown up and above a major daily resistance level that had been containing price for the previous 12 days. As the two daily charts show below; both zoomed out and in, this key level is of major significance to price and now the price has broken through, it could become a ‘price flip’ level and hold as a new support level.

As the zoomed out chart shows below; this level has been a proven price flip level going back a long way that has acted as both a support and resistance level. Now that price is above the resistance level it will be crucial to see how the price action behaves if we do get a re-test at the old support/new resistance level.

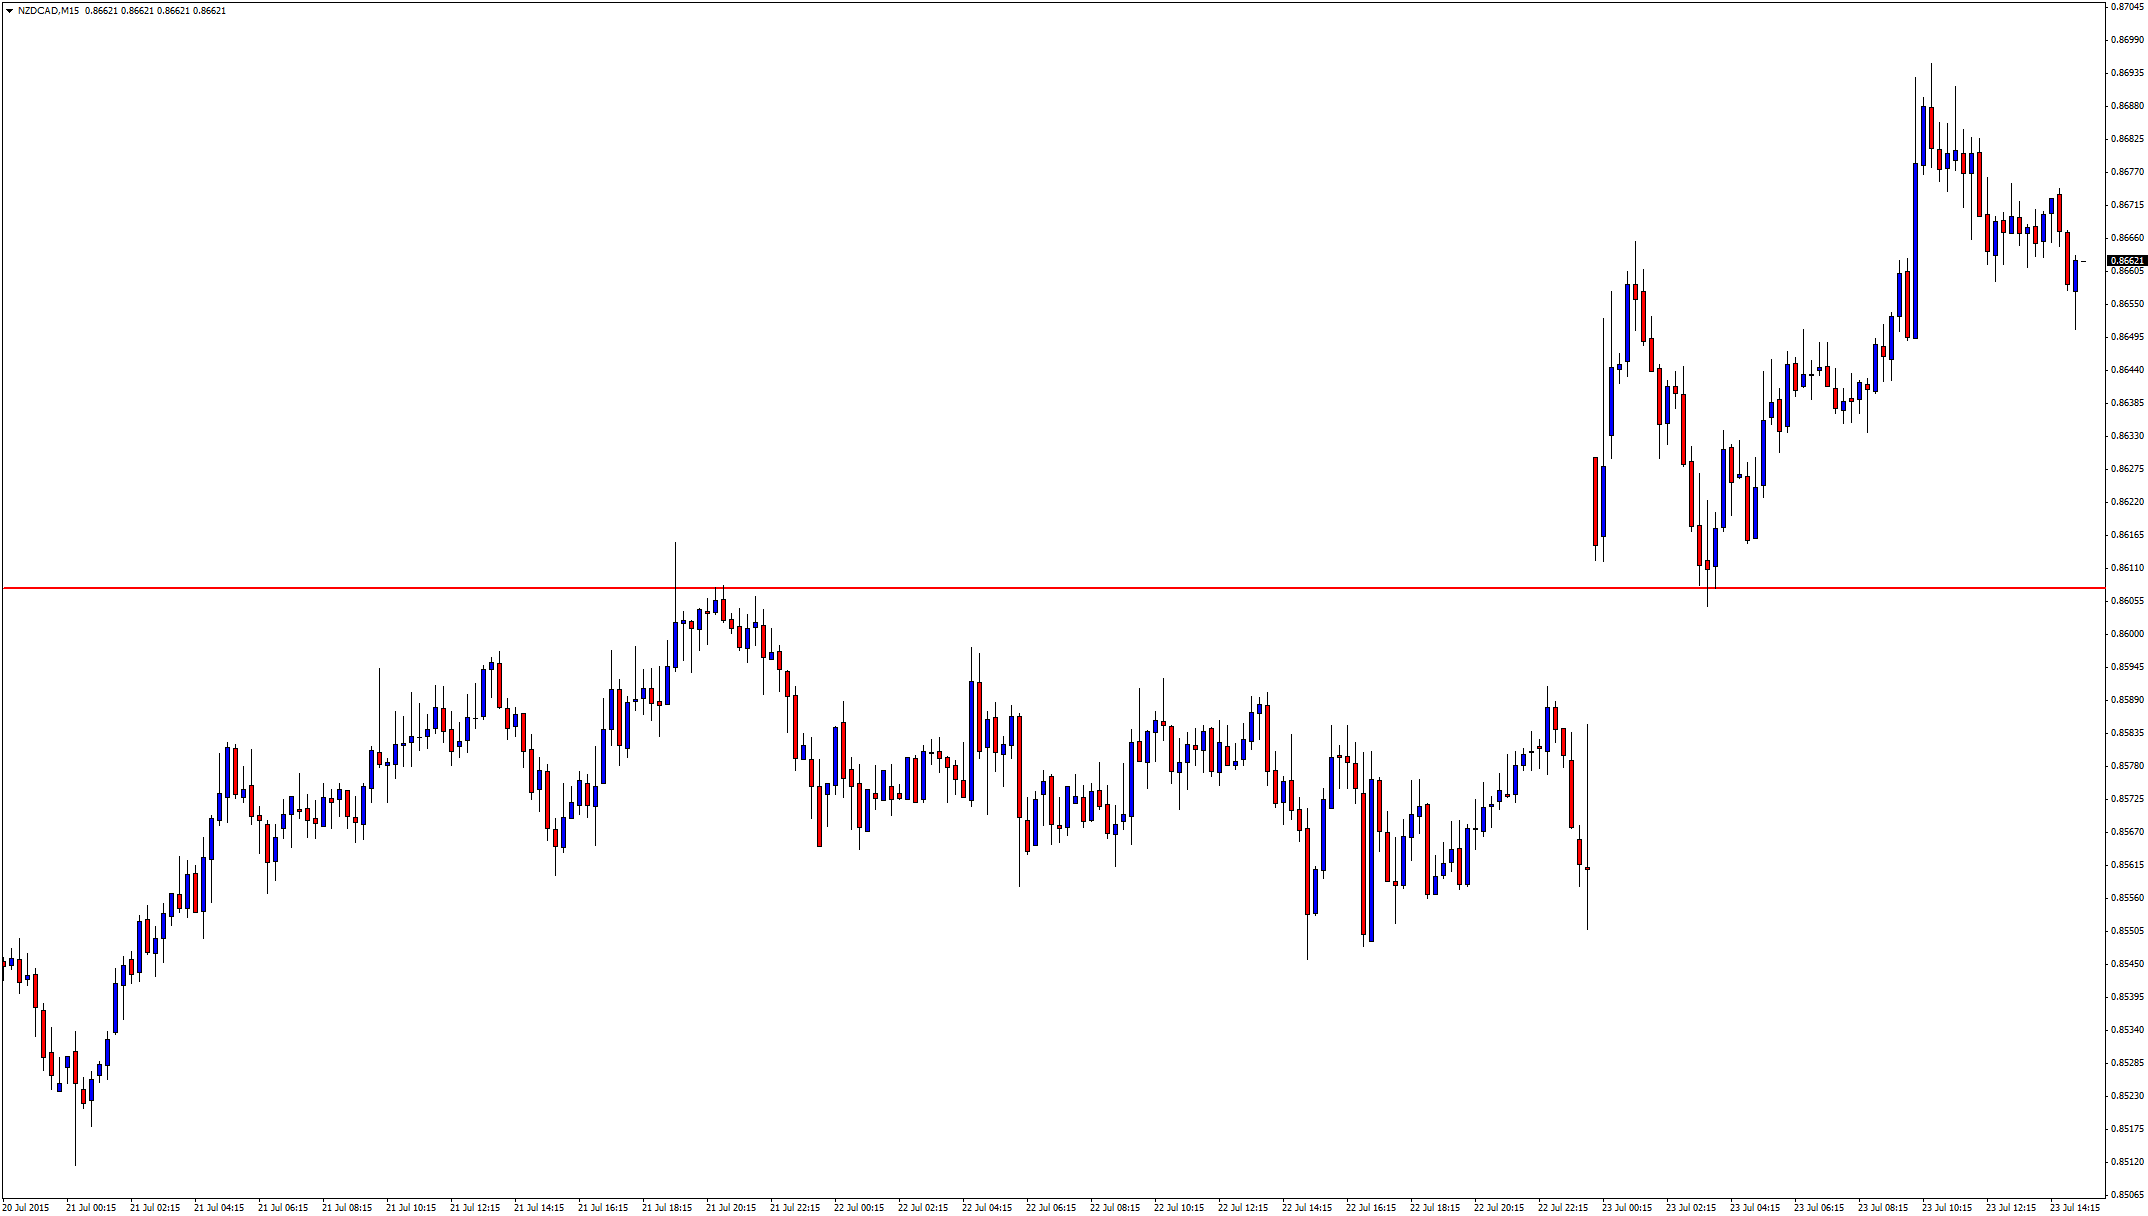
If price does pull-back into the price flip area, you could watch the key daily area for potential high probability A+ bullish trigger signals to get long, just like the trade setups I teach my members in the Lifetime Membership Price Action Course. For any trades to be confirmed you are going to need to see quality bullish trigger signals formed at this new support area.

If price can move back higher the near term support looks to come in around the 0.87550 area as I have marked on the daily chart below.


MAJOR IMPORTANT NOTE: Become a FREE *VIP* Class Member and receive behind closed door teachings not shown to the public! Sign up to become a student here;


FREE Vip Members Class


Daily Chart Zoomed Out

NZDCAD Zooms Out


Daily Chart In

NZDCAD price action

15 Minute Chart

15 minute chart price action chart


Related Forex Trading Education

– The Ultimate Guide to Marking Support and Resistance on Price Action Charts

Recommended Broker

  • Broker
  • Min Deposit
  • Benefits
  • Score
  • Visit Broker

$200

T&Cs Apply
  • The Lowest Trading Costs
  • 50% Welcome Bonus
  • Award-winning 24 Hour Support
5
Trade Now FreeBets Reviews
Reviews

About Johnathon Fox

Johnathon is a Forex and Futures trader with over ten years trading experience who also acts as a mentor and coach to thousands and has written for some of the biggest finance and trading sites in the world.

View all posts by Johnathon Fox →
Previous Post: « GBPNZD Moves Into 50% Fibonacci Level Within Strong Trend | 21 July 2015
Next Post: High Probability A+ Pin Bar Sends Price Lower From Great Level | 24th July 15 »

Reader Interactions

Comments

  1. Jackson says

    07/24/2015 at 12:08 PM

    Hi Jonathan,

    Would like to post a quick question. From the 4H chart, it looks like a classic setup where price broke resistance and is retracing to value area for us to enter long from a valid PA. But looking at the Daily Chart, it seems like the trend is towards the downside and a Daily selling Pin Bar has formed.

    Since there are two conflicting views on different timeframe, and that the higher timeframe should be more reliable, shouldn’t we go Short?

    Please advise! 🙂

    Reply
    • Johnathon Fox says

      07/24/2015 at 11:33 PM

      Hi Jackson,

      both the daily & 4 hour charts are not valid trade setups as they do not meet the basic pin bar criteria.

      You will note on the daily chart the pin bar does not open & close like it should for a pin bar and on the 4 hour chart the pin bar does not have a nose that is 3 x. The 4 hour pin also does not stick out and away from all other price like we would need it to.

      Please read the lesson that I think will really help on pin bars here; https://www.forexschoolonline.com//pinbar/ and also; https://www.forexschoolonline.com//pin-bar-reversal/

      Any questions just let me know,

      Johnathon

      Reply

Leave a Reply Cancel reply

Your email address will not be published. Required fields are marked *

Primary Sidebar

Forex School Online

High Probability Price Action Trading

How to make, manage and take profit from trades in the markets

Start Learning (It's Free!)

Turn Your Trades into Winners!

The Price action course is the in-depth advanced training on assessing, making and managing high probability price action trades.

Sign up for Free!

Recommended Broker

  • Broker
  • Min Deposit
  • Benefits
  • Score
  • Visit Broker

$200

T&Cs Apply
  • The Lowest Trading Costs
  • 50% Welcome Bonus
  • Award-winning 24 Hour Support
5
Trade Now FreeBets Reviews
Reviews

Footer

Get Our FREE Course, Bonus Strategies & Indicators!
X
Join Us Now!

Your capital is at risk.

X

CORNERSTONE LESSONS

Forex Trading for Beginners

Price Action Trading

How to Trade Forex

Technical Analysis

Forex Charts

Forex Trading Strategies

Money Management 

Compare Brokers

Best Forex Brokers

Forex Demo Accounts

Best Forex Trading Platforms

Forex Apps

Swap Fee Accounts

MT4 Brokers

CATEGORIES

Forex Videos

Trading Lessons

Weekly Trade Ideas

Start Here Guide

ForexSchoolOnline.com helps individual traders learn how to trade the Forex market

WARNING: The content on this site should not be considered investment advice and we are not authorised to provide investment advice. Nothing on this website is an endorsement or recommendation of a particular trading strategy or investment decision. The information on this website is general in nature so you must consider the information in light of your objectives, financial situation and needs.

Investing is speculative. When investing your capital is at risk. This site is not intended for use in jurisdictions in which the trading or investments described are prohibited and should only be used by such persons and in such ways as are legally permitted. Your investment may not qualify for investor protection in your country or state of residence, so please conduct your own due diligence or obtain advice where necessary. This website is free for you to use but we may receive a commission from the companies we feature on this site.

We Introduce people to the world of currency trading. and provide educational content to help them learn how to become profitable traders. we're also a community of traders that support each other on our daily trading journey

Forexschoolonline.com is not a financial advisor. Do your research before investing your funds in any financial asset or presented product or event. We are not responsible for your investing results.

Copyright © Forex School Online Sitemap  - Privacy Policy - Disclaimers & Terms of Use - CONTACT US