• Skip to primary navigation
  • Skip to main content
  • Skip to primary sidebar
  • Skip to footer

ForexSchoolOnline.com

Learn to Trade Forex Online

  • Compare Brokers
    • Broker Type
      • Paypal Brokers
      • Swap-Free Brokers
      • Low Spread Brokers
      • ECN / STP Brokers
      • Market Maker Brokers
      • Non Dealing Desk Brokers
      • Low Minimum Deposit Brokers
    • Country
      • Brokers for Australia
      • Brokers for South Africa
      • Brokers for the UK
      • Brokers for the US
      • Brokers for Nigeria
    • Regulation
      • FCA Regulated Brokers
      • ASIC Regulated Brokers
      • FSCA Regulated Brokers
      • CFTC Regulated Brokers
    • Platform
      • MT4 Brokers
      • MT5 Forex Brokers
    • Strategies
      • Hedging Forex Brokers
      • Scalping Forex Brokers
      • Carry Trade Forex Brokers
      • Brokers for Indicators and EA’s
  • Start Here
    • Start Trading Guide
    • Beginner Trading Lessons
  • Free Forex Course
    • Public Login
    • Register
    • Password recovery
  • Lessons
    • Strategies
    • Videos
    • MT4 Guides
    • Money Management
  • Trade Setups
  • Tools
    • Correct Free Demo Charts
    • Forex Journal Download
    • Position Size Calculator
    • FULL List of Tools
    • Forex Demo Accounts
  • Price Action Guide
  • Free Course
Johnathon Fox
04/01/2016 | UPDATED ON: 08/06/2019

Price Retraced Almost to Pip on 15 Min NZDUSD Chart & How You Can Take Advantage With More Precise Levels | 31 Mar 16

If we mark our major support and resistance levels and ‘kill zones’ correctly, then we can be presented with the potential to get into high probability trades on many different time frames including smaller time frames.

Whilst we are marking our major levels on the daily charts, we can use these same levels to hunt for trigger signals on smaller time frames such as the 8 hour, 4 hour, 2 hour, 1 hour or even smaller time frames like the 15 minute chart if you are comfortable and you have proved yourself profitable on the higher time frame charts.

I do not move to any charts smaller than the 15 minutes as I find that the 15 minutes still provides a happy medium of price action you can rely on and enough time to make quality decisions. If you have not yet proved yourself on higher time frames and are not yet making profits on higher time frames, then read this here;

Trading Daily Chart Price Action Strategies Down to the Intraday Time Frames

Hunting trades using levels from the daily charts ensures that no matter what time frame we are on whether it be the 8 hour chart of the 1 hour chart, we know we are making a trade from a major level. What I want to highlight today is something that a lot of traders get confused about.


Quick Lesson on Marking Levels More Precisely

The lesson on the routine, time frames and order of marking your major support and resistance levels if you need to quickly read over it can be found at; The Ultimate Guide to Support and Resistance

Whilst we are marking our major levels on the daily charts and then using these levels to hunt our trades on smaller time frames, we are not robots – we are price action traders. Our job is to read the price action story, put it altogether and then trade within it!

What will often happen is the level we mark on the daily chart will not be precise enough for a smaller time frame such as the 1 hour or especially 15 minute chart. If we just leave this level there we will more often than not just watch price move away from our level without us on the trade.

Remember; we are price action traders – our job is to read the story. When we get to the smaller chart, we should adjust the level slightly to make it more precise. You want to ensure that the level is STILL the daily level, but you will often notice that you can make it more relevant to where price is actually going to reject or the recent price flip.

You will often notice matching candle highs and lows all rejecting the same area. So place your level more precisely there.

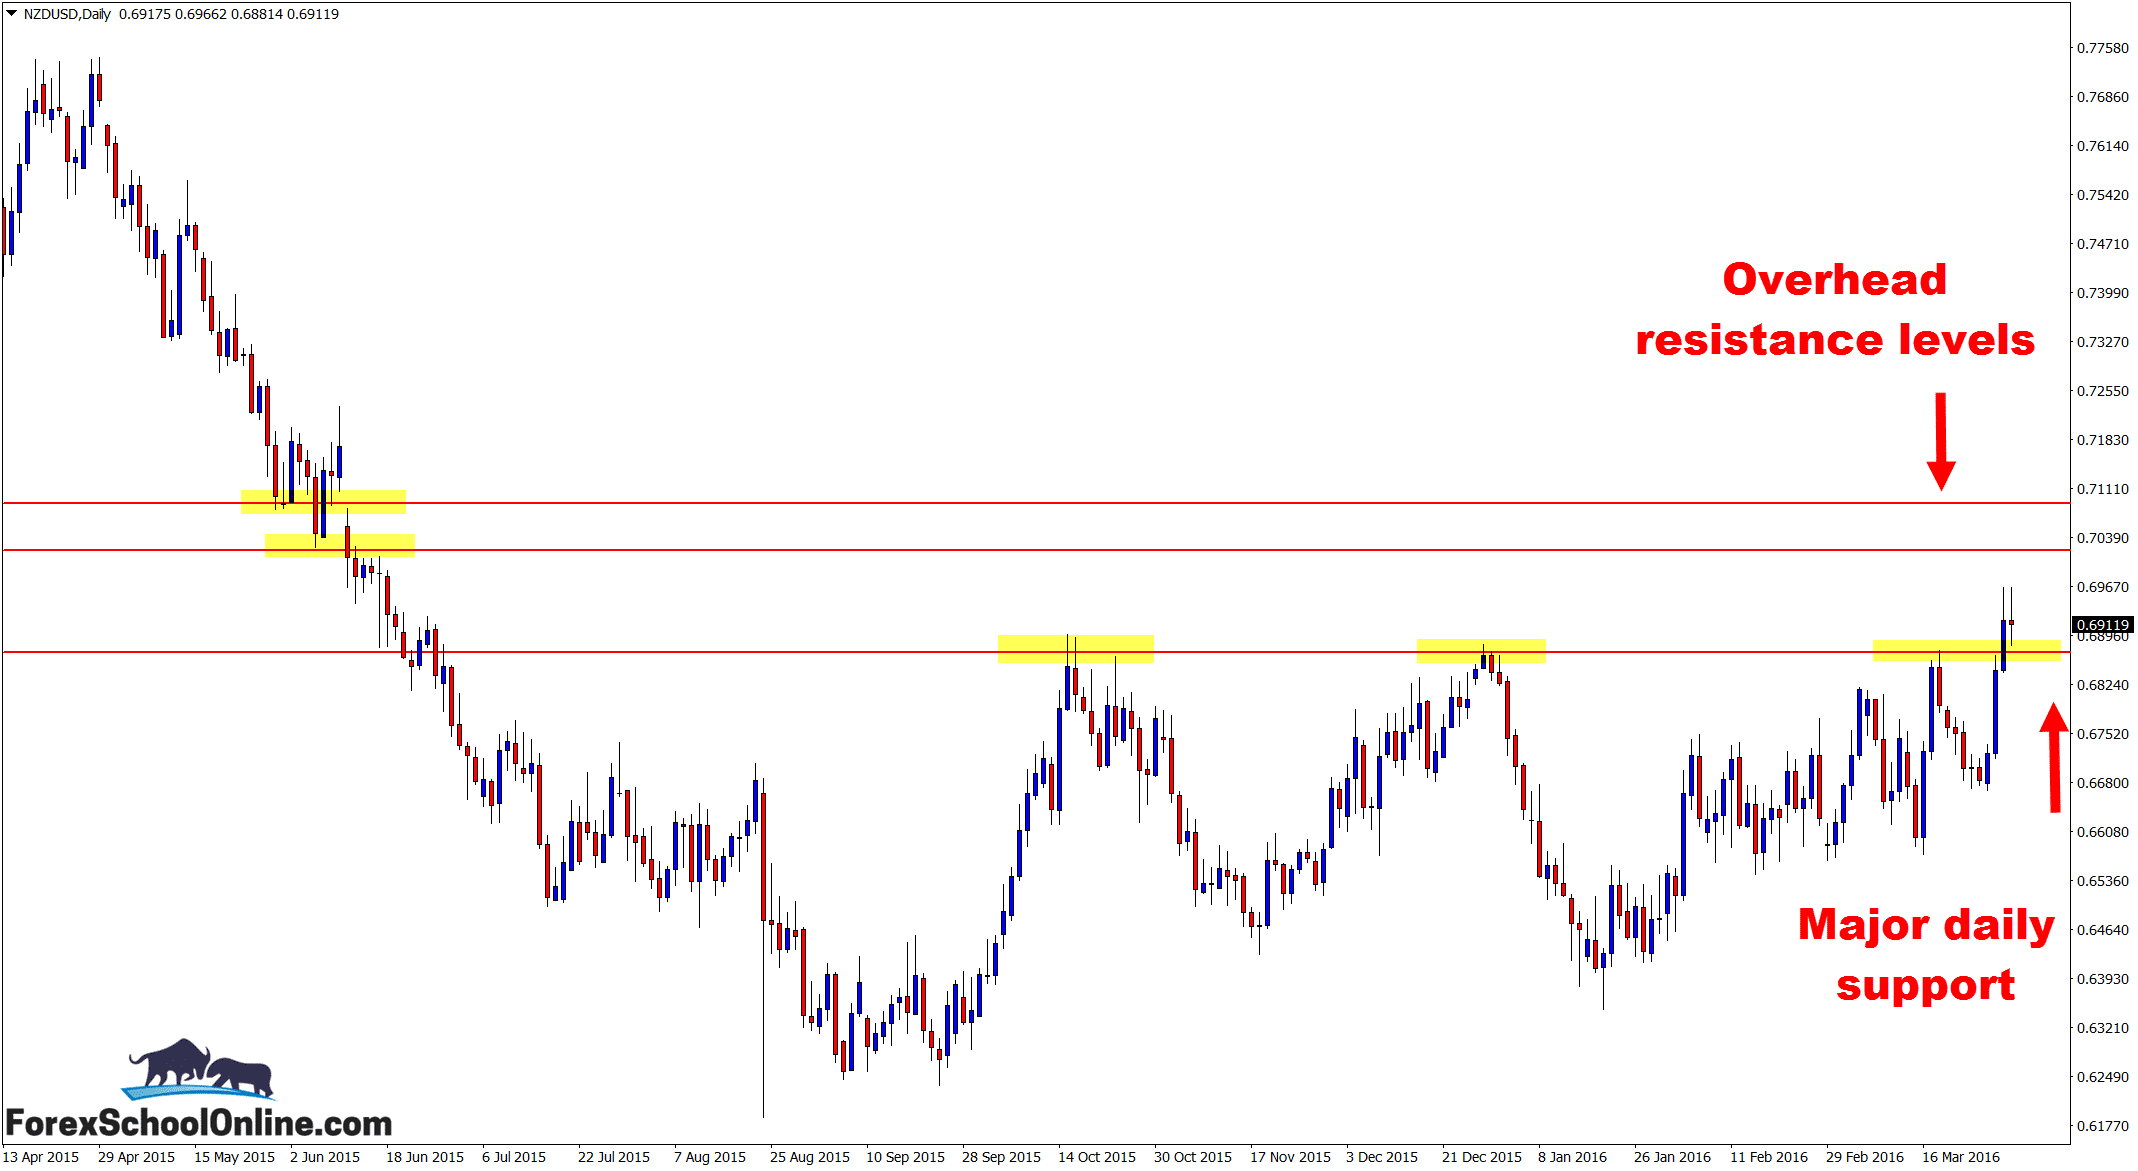
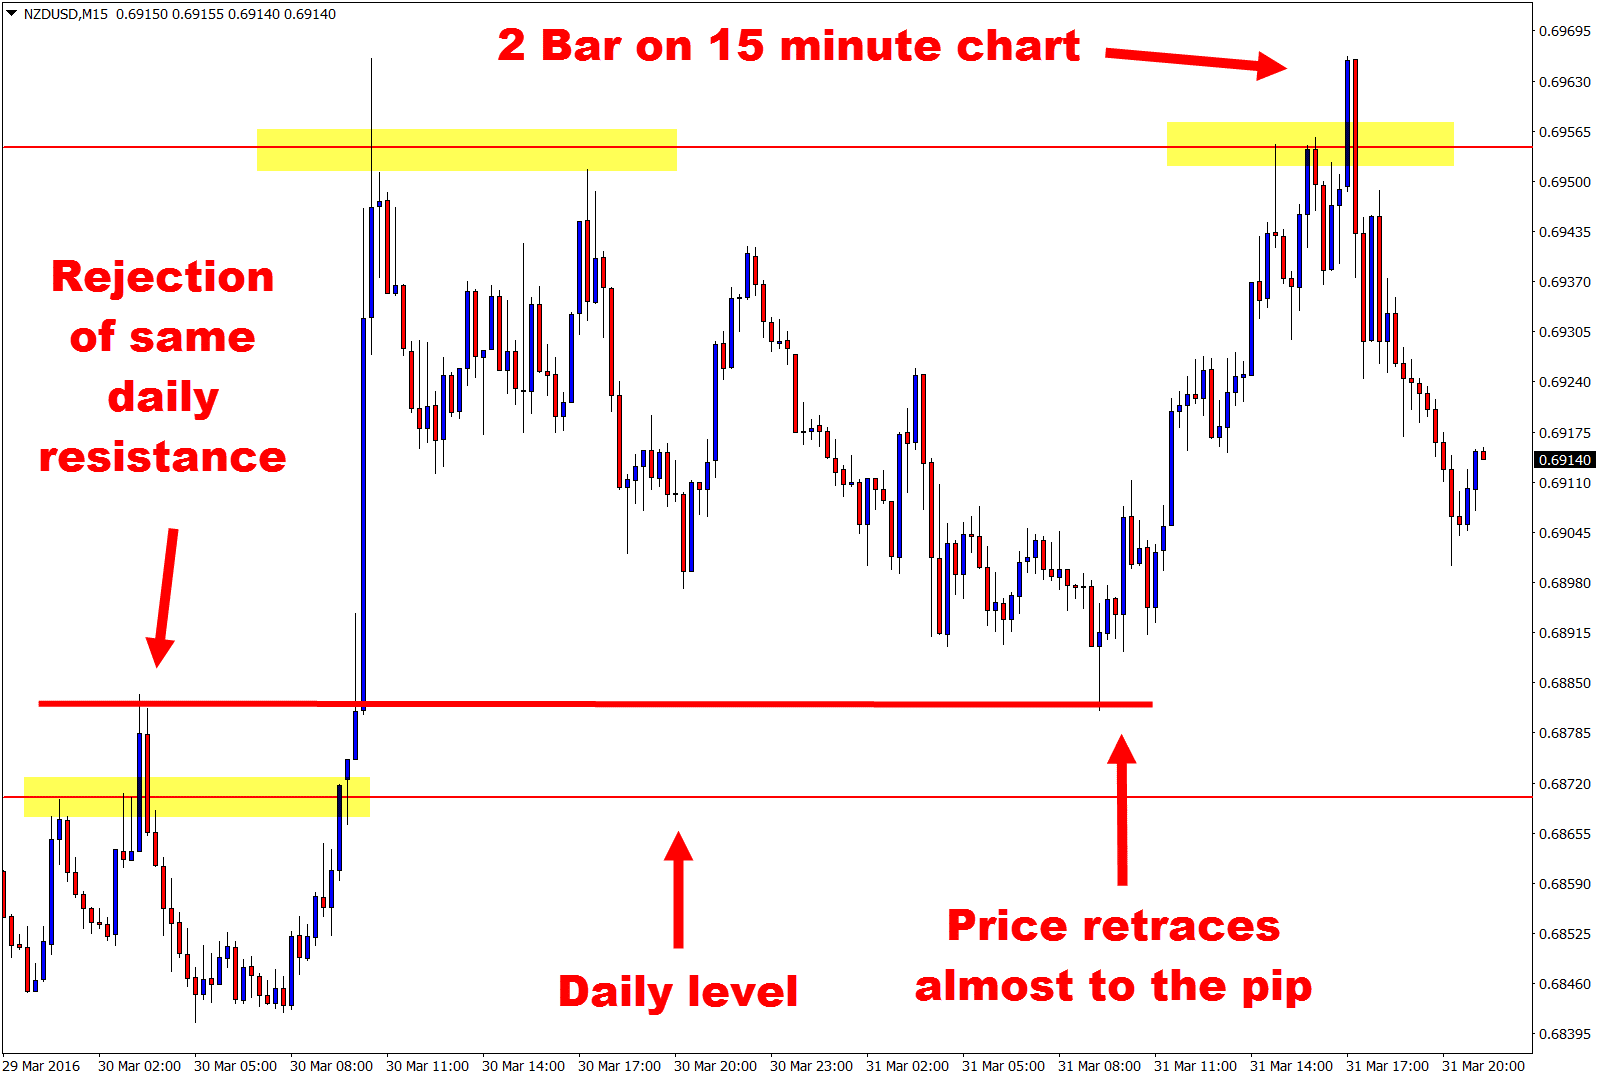
Notice how this works on the 15 minute chart of the NZDUSD; Price broke through the resistance with a strong break, before returning to the new support price flip. You can see on the chart below there are two levels; the first is the daily level, and the second is the level where price retraced to almost to within a pip.


Daily NZDUSD Chart

NZDUSD price action chart


15 Minute NZDUSD Chart

15 minute technical anylsis


Related Forex Trading Education

  • The Ultimate Guide to Support and Resistance


Recommended Broker

  • Broker
  • Min Deposit
  • Benefits
  • Score
  • Visit Broker

$200

T&Cs Apply
  • The Lowest Trading Costs
  • 50% Welcome Bonus
  • Award-winning 24 Hour Support
5
Trade Now FreeBets Reviews
Reviews

About Johnathon Fox

Johnathon is a Forex and Futures trader with over ten years trading experience who also acts as a mentor and coach to thousands and has written for some of the biggest finance and trading sites in the world.

View all posts by Johnathon Fox →
Previous Post: « Reading the Price Action Story to the Pip on the Palladium Chart | 24th Mar 16
Next Post: Use the Coin Flip Exercise to Gain Edge Over the Other Traders »

Reader Interactions

Leave a Reply Cancel reply

Your email address will not be published. Required fields are marked *

Primary Sidebar

Forex School Online

High Probability Price Action Trading

How to make, manage and take profit from trades in the markets

Start Learning (It's Free!)

Turn Your Trades into Winners!

The Price action course is the in-depth advanced training on assessing, making and managing high probability price action trades.

Sign up for Free!

Recommended Broker

  • Broker
  • Min Deposit
  • Benefits
  • Score
  • Visit Broker

$200

T&Cs Apply
  • The Lowest Trading Costs
  • 50% Welcome Bonus
  • Award-winning 24 Hour Support
5
Trade Now FreeBets Reviews
Reviews

Footer

Get Our FREE Course, Bonus Strategies & Indicators!
X
Join Us Now!

Your capital is at risk.

X

CORNERSTONE LESSONS

Forex Trading for Beginners

Price Action Trading

How to Trade Forex

Technical Analysis

Forex Charts

Forex Trading Strategies

Money Management 

Compare Brokers

Best Forex Brokers

Forex Demo Accounts

Best Forex Trading Platforms

Forex Apps

Swap Fee Accounts

MT4 Brokers

CATEGORIES

Forex Videos

Trading Lessons

Weekly Trade Ideas

Start Here Guide

ForexSchoolOnline.com helps individual traders learn how to trade the Forex market

WARNING: The content on this site should not be considered investment advice and we are not authorised to provide investment advice. Nothing on this website is an endorsement or recommendation of a particular trading strategy or investment decision. The information on this website is general in nature so you must consider the information in light of your objectives, financial situation and needs.

Investing is speculative. When investing your capital is at risk. This site is not intended for use in jurisdictions in which the trading or investments described are prohibited and should only be used by such persons and in such ways as are legally permitted. Your investment may not qualify for investor protection in your country or state of residence, so please conduct your own due diligence or obtain advice where necessary. This website is free for you to use but we may receive a commission from the companies we feature on this site.

We Introduce people to the world of currency trading. and provide educational content to help them learn how to become profitable traders. we're also a community of traders that support each other on our daily trading journey

Forexschoolonline.com is not a financial advisor. Do your research before investing your funds in any financial asset or presented product or event. We are not responsible for your investing results.

Copyright © Forex School Online Sitemap  - Privacy Policy - Disclaimers & Terms of Use - CONTACT US