Quant Price Forecast: July 17
The Quant (QNTUSD) price is showing more jumps ahead at the mentioned supply value. Having finished the downward correction, the crypto might likely continue its upside move if the current support at $102.06 value holds, and the daily chart closes above the $152.00 resistance level, then there is a high probability of the price going up to its recent swing high, which is $168.38 resistance trend line.
Key Levels:
Resistance Levels: $120.00, $119.00, $118.00
Support Levels: $106.00, $105.00, $104.00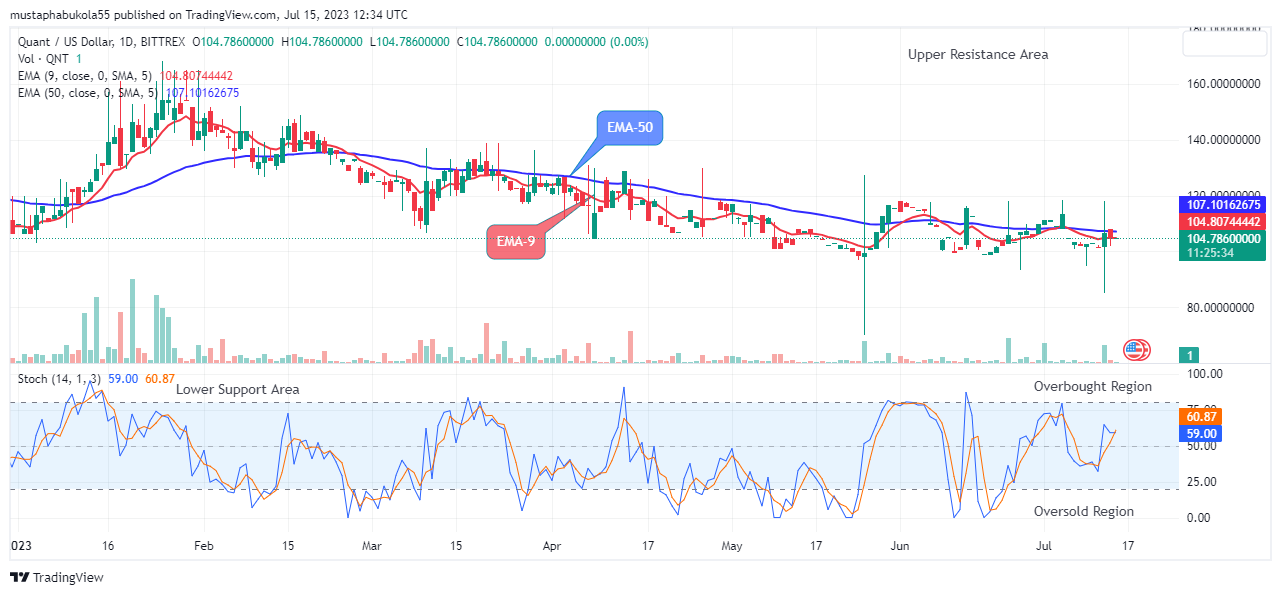
QNTUSD Long-term Trend: Bearish (Daily chart)
QNTUSD is bearish in its long-term outlook. The price responded to the shift in the market structure and is currently trading below the moving averages.
The bearish pressure at the $102.06 support level in the past action has made the coin stay below the supply trend levels in recent times. However, this will soon be invalidated as the trend has just resumed its rising pattern but has not yet reached its goal.
The coin has completed its correction and is now set for an upswing. The bulls have decided to shift the trend up after a series of lows shortly after today’s daily chart opens.
As of now, the Quant price is trading at the $104.78 supply mark below the moving averages, showing an intraday gain for the day. The coin’s price has attempted to break out of a long-term trend line with an intense buying force. Hence, a strong push above the $168.38 previous high will offer strong resistance to the crypto price.
However, the market price of QNTUSD is pointing up in the oversold region; this means that the momentum in the coin price will likely remain and continues in an upward move. We can now expect the next jump by the bulls to reach a $400.00 upper resistance level in the days ahead in its higher time frame.
QNTUSD Medium-term Trend: Bearish (4H chart)
The QNTUSD price is in a bearish move in its medium-term outlook. The prices are seen slightly below the moving averages, this is due to the brief returns of sellers which may soon fade off. 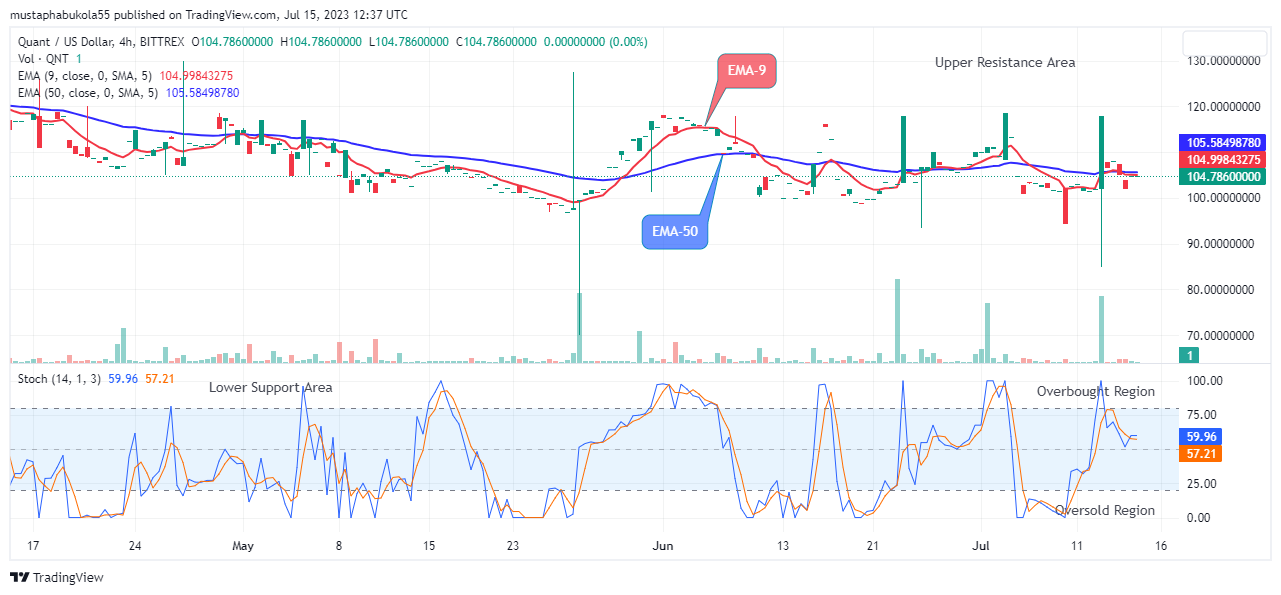
The interference of the bears at the $102.06 support level in the previous action has made the crypto price trade below the supply trend level in recent times.
The sudden jump in Quant price to the $104.78 high level below the two EMAs as the 4-hourly chart resumes today projects a potential challenge to the resistance trend line. A potential bullish crossover above the previous high of $130.02 moving signal line projects a buy signal.
Furthermore, the daily stochastic signals an uptrend, if the bulls could push harder and sustain the coin price above the $111.99 high level, the resulting rally may surpass the $130.02 previous high level and hit the $400.00 psychological level at the upside in the days ahead in its medium-term perspective.
Place winning Quant trades with us. Get QNT here
Learn to Trade Forex Online
Quant (QNTUSD) Price Showing More Jumps Ahead at the $104.78 Correction Value
Footer

ForexSchoolOnline.com helps individual traders learn how to trade the Forex market
WARNING: The content on this site should not be considered investment advice and we are not authorised to provide investment advice. Nothing on this website is an endorsement or recommendation of a particular trading strategy or investment decision. The information on this website is general in nature so you must consider the information in light of your objectives, financial situation and needs.
Investing is speculative. When investing your capital is at risk. This site is not intended for use in jurisdictions in which the trading or investments described are prohibited and should only be used by such persons and in such ways as are legally permitted. Your investment may not qualify for investor protection in your country or state of residence, so please conduct your own due diligence or obtain advice where necessary. This website is free for you to use but we may receive a commission from the companies we feature on this site.
We Introduce people to the world of currency trading. and provide educational content to help them learn how to become profitable traders. we're also a community of traders that support each other on our daily trading journey
Forexschoolonline.com is not a financial advisor. Do your research before investing your funds in any financial asset or presented product or event. We are not responsible for your investing results.
Leave a Reply