Weekly Price Action Trade Ideas – 17th to 22nd Feb 2019
Markets Discussed: AUDNZD, GOLD, OIL v USD and S&P 500
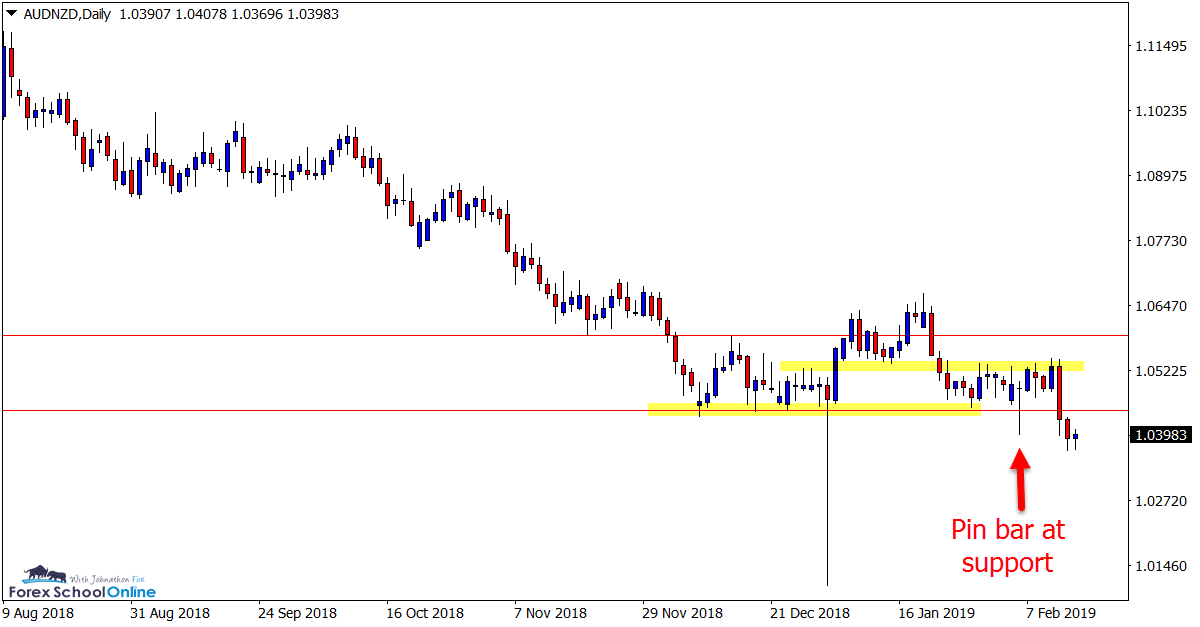
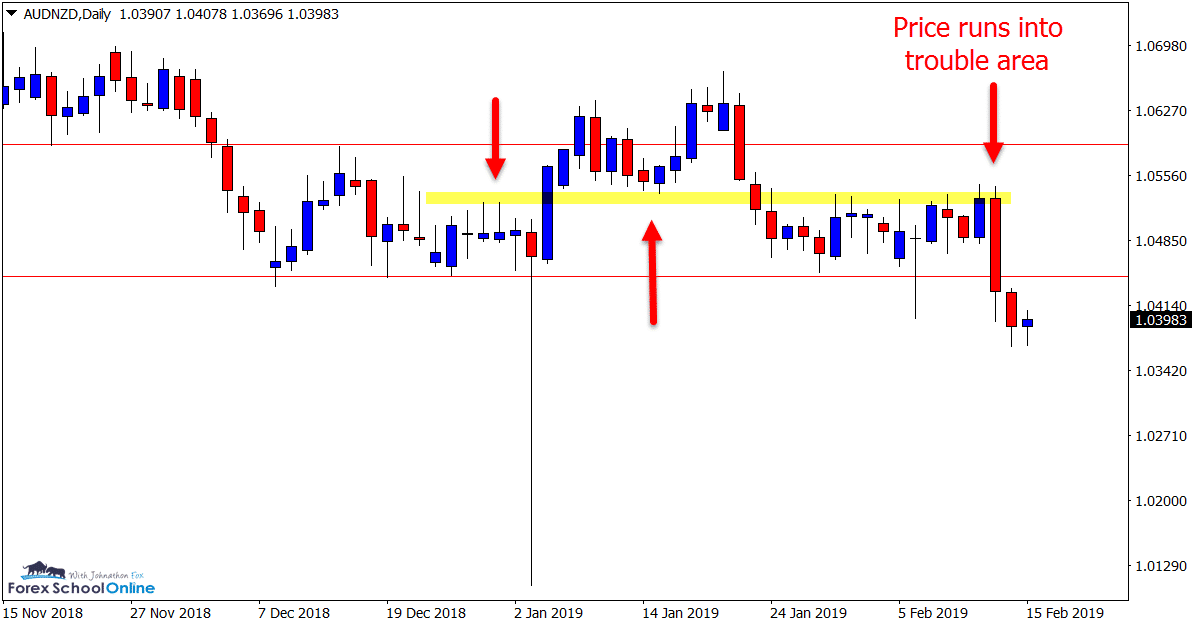
AUDNZD Daily Chart
Price Hits ‘Trouble Area’ and Collapses
Price this week has collapsed lower and through what looks to be a crucial support level on the AUDNZD daily chart.
Last week we looked at and discussed the pin bar reversal on this pair and how price had moved higher and into a ‘trouble area’.
Price tested this trouble area for five consecutive days before selling off and collapsing to close below the major support.
These trouble areas are key when making trade entries and can be used to help identify potential areas where price may face trouble moving higher or lower. This can help us decide whether we want to make the trade, or when in a trade identify high probability profit target points.
Daily Chart
Daily Chart
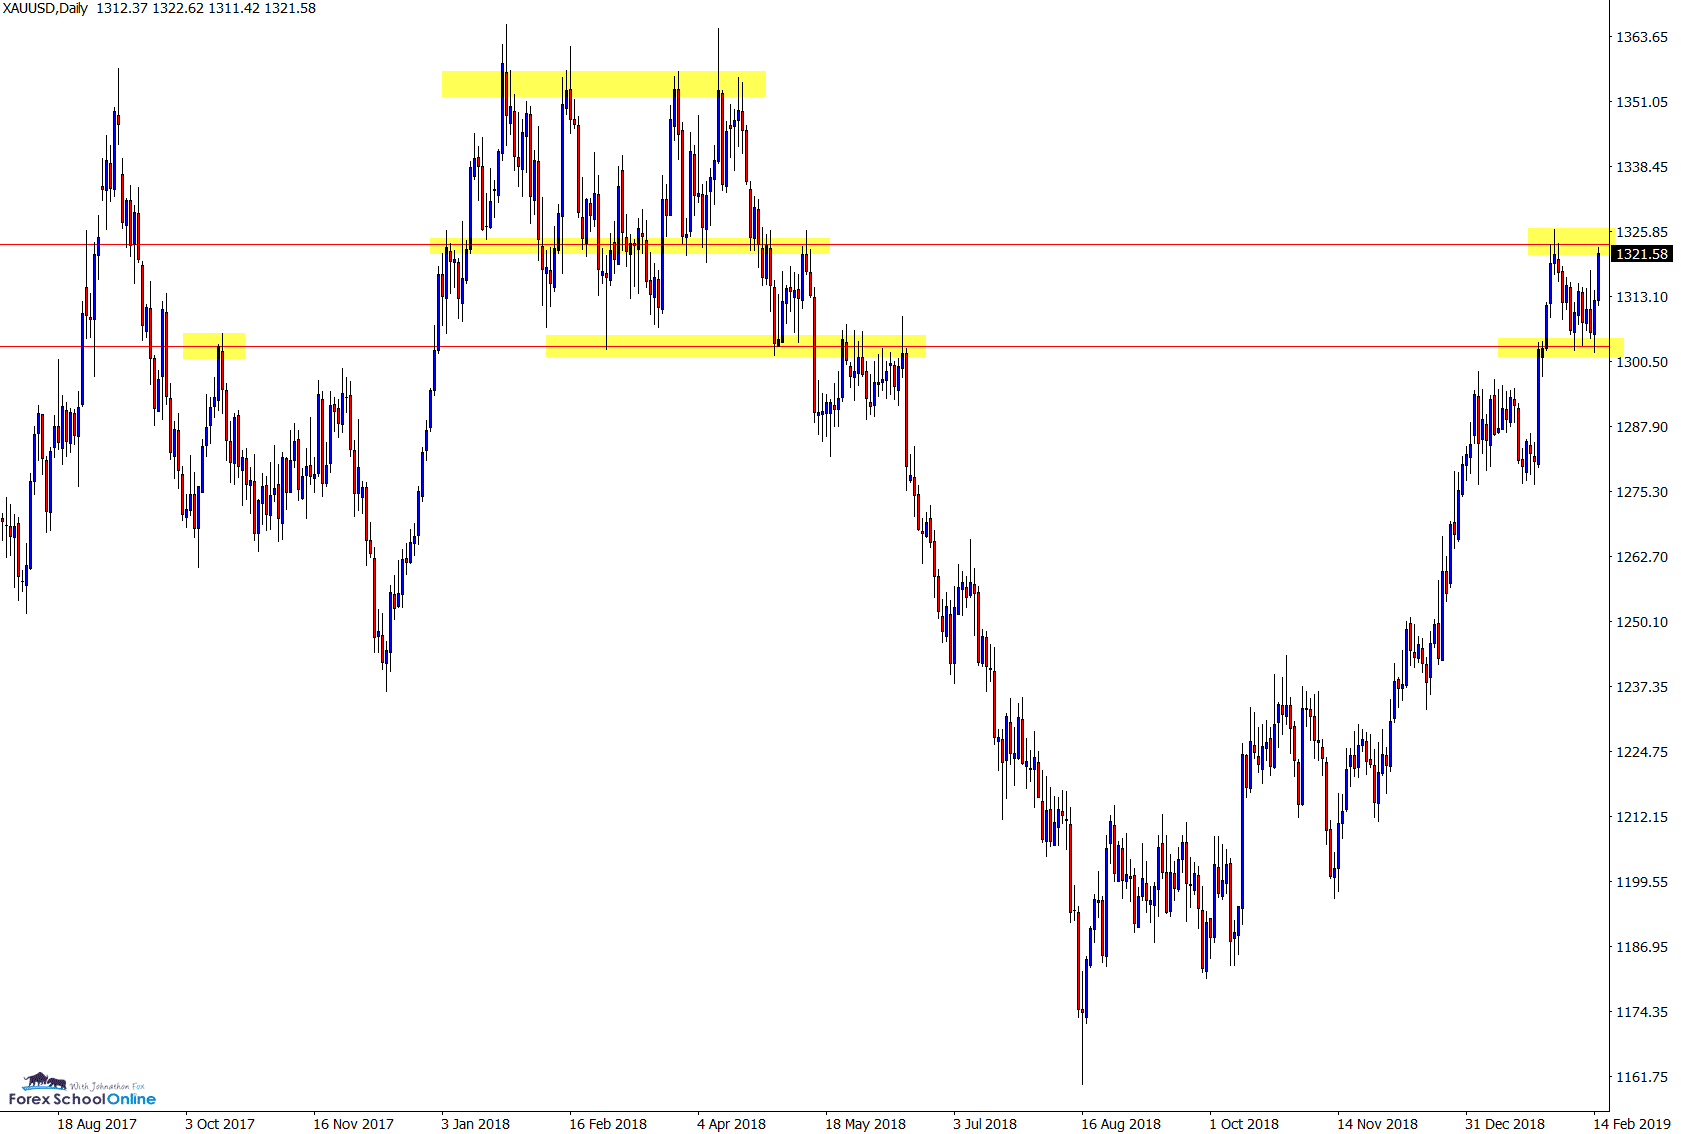
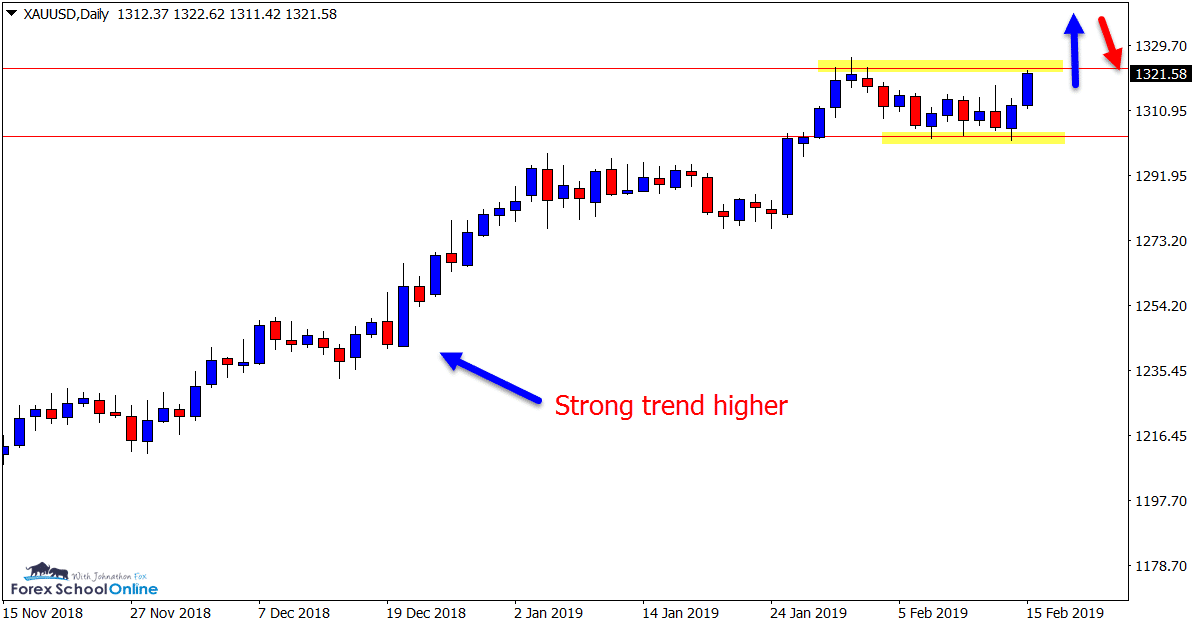
GOLD Daily Chart
Bounce From Support and Trend Continues
This has been a super interesting market to chart over the past few months with price bouncing from the extreme lows, consolidating and moving into a market trend reversal higher.
As the chart shows below and we discussed in the 3rd Jan charts in focus post; price faced a stiff resistance to continue this trend and create a new high.
Price sold off at this resistance level, but has since moved back higher after finding support at the near-term support.
We now find price looking to make another test of the same resistance to see if it can create a new high in this trend and push onto the extreme highs of 2018.
Any solid breaks of the resistance and bullish traders could look for potential breakouts or breakout and quick re-test trade setups.
Daily Chart
Daily Chart
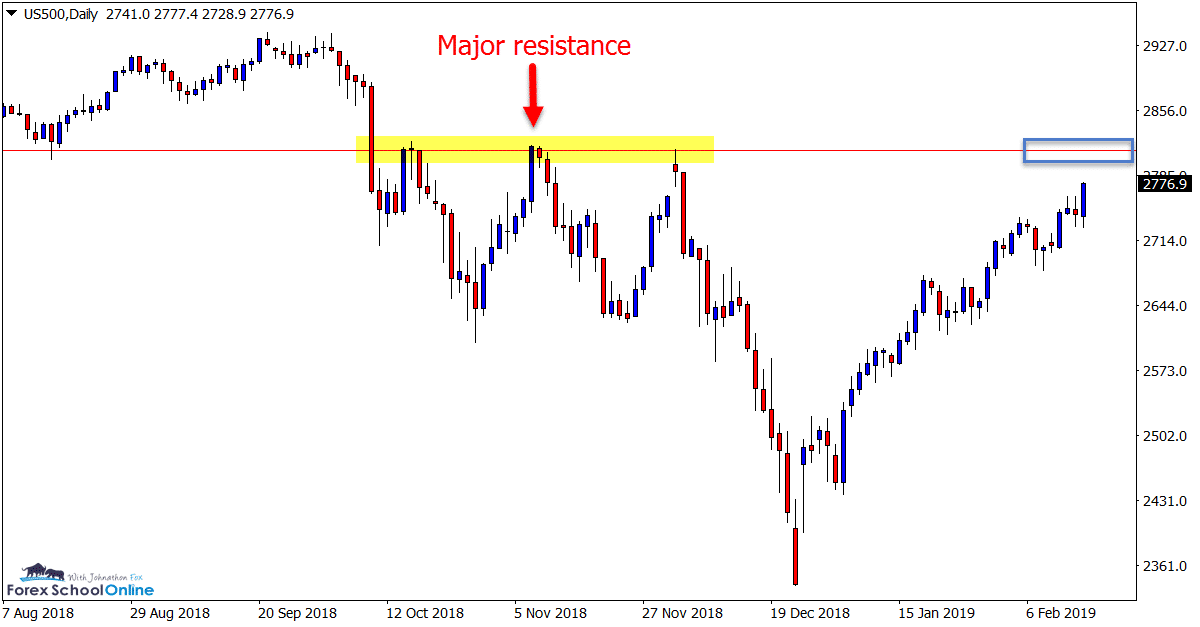
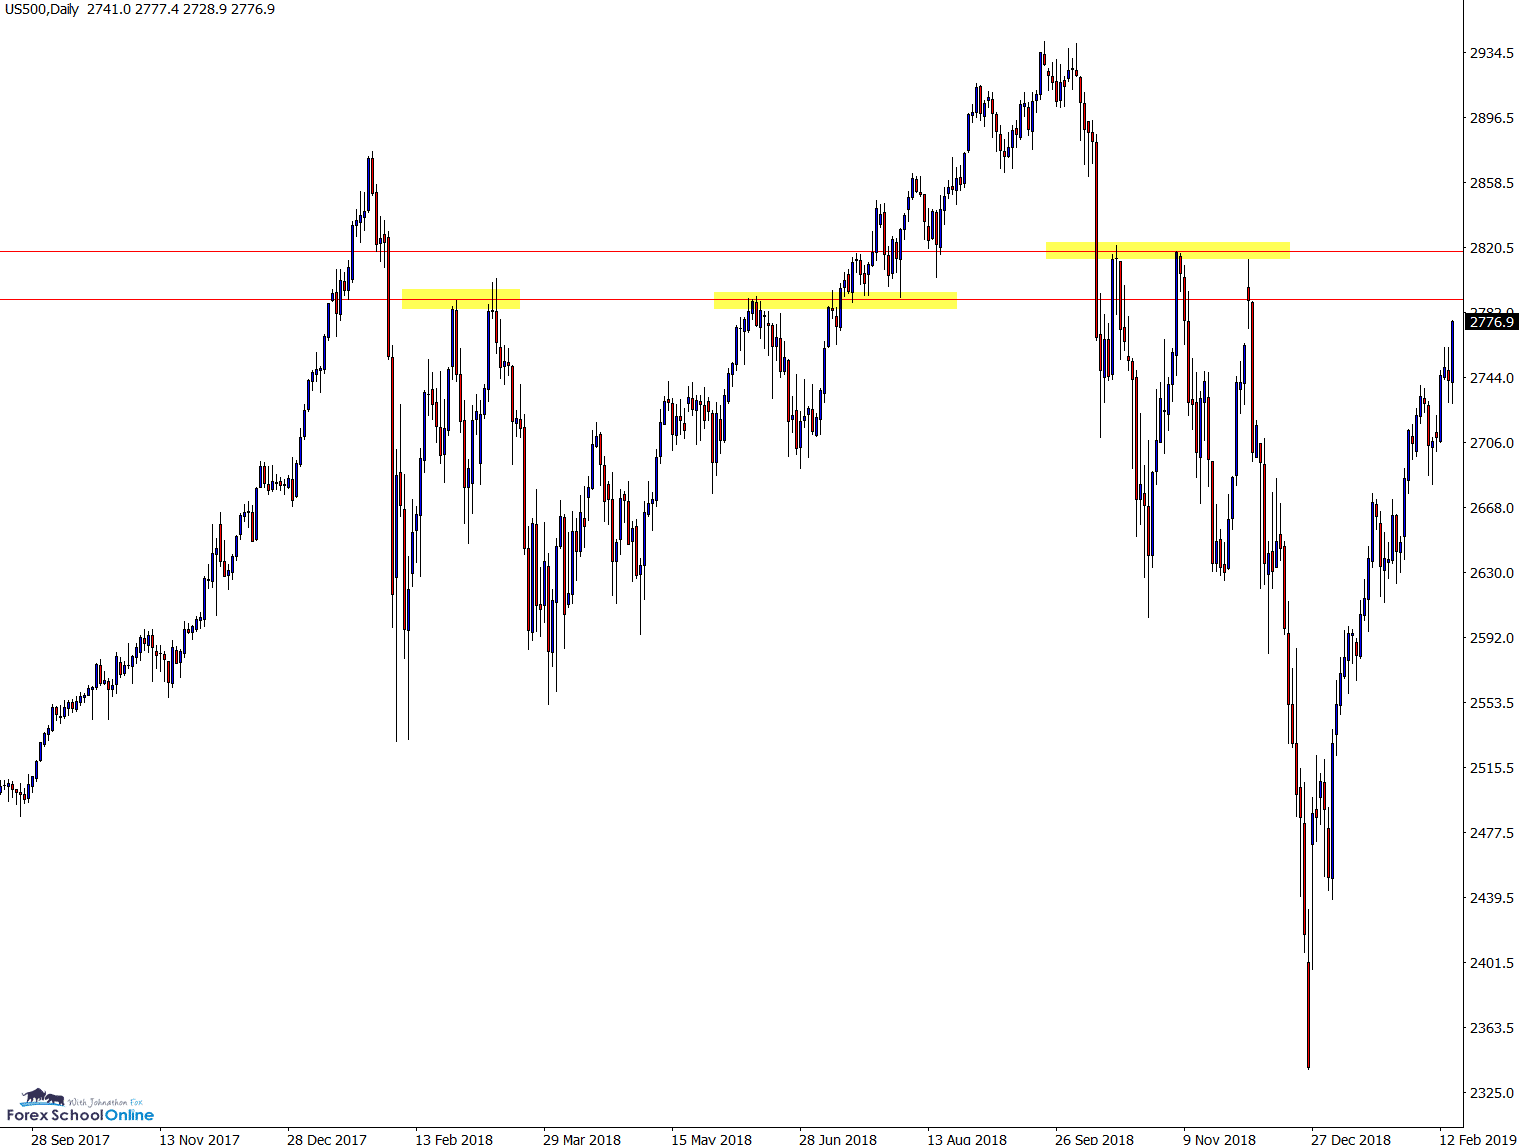
S&P 500 Daily Chart
Find Out Where the Bears Are
In the span of two months this market has completely changed.
After being crunched lower, we have now seen a stunning surge higher. It is going to be a very interesting watch to see where the bears and sellers come out in this market.
We have a close overhead resistance as shown on the chart below; with a major resistance parked around the 2813.00 area.
The more aggressive traders will be watching this major daily level to see the price action clues and if price wants to pull-back, if even only for a short time.
Daily Chart
Daily Chart
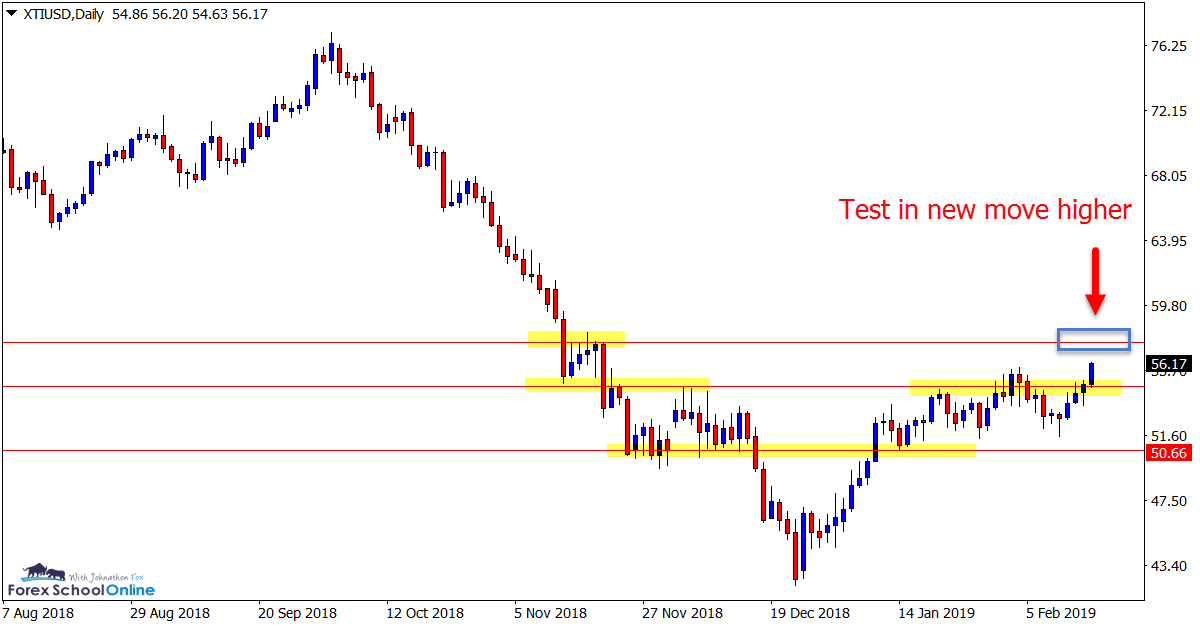
Oil Daily Chart
Market Forms Reversal and is Moving Higher
We have been watching a market reversal take place on the daily chart of Oil v USD of late.
Price action rejected the lows, consolidated and has now gone onto form a fresh higher high signalling it is looking to push higher.
The next test for this market comes around the 57.50 area, but if price can break this level we could see the bulls take full control.
Watching to see if this level breaks could open potential trading opportunities. A quick breakout and then re-test of the old resistance and new support could offer a solid way to get into the move higher.
Daily Chart
Note: We Use Correct ‘New York Close 5 Day Charts’ – Download Free New York Close Demo Charts Here
Charts in Focus Note: All views, discussions and posts in the ‘charts in focus’ are the view of Forex School Online and are not recommendations or trading advice. All posts are general in nature and are not advice to buy or sell.
Please leave questions or comments in the comments section below;

Great analysis Jonathon!
Keep up the great work!
Thanks for the comment Gary 👍👍
Johnathon