Weekly Price Action Trade Ideas – 5th to 10th May
Markets Discussed in This Week’s Trade Ideas: AUDUSD, CHFJPY, AUDJPY and OIL v USD.
Note: We Use Correct ‘New York Close 5 Day Charts’ – You can read about why we use these and how to download the correct free charts at Correct Free New York Close Demo Charts
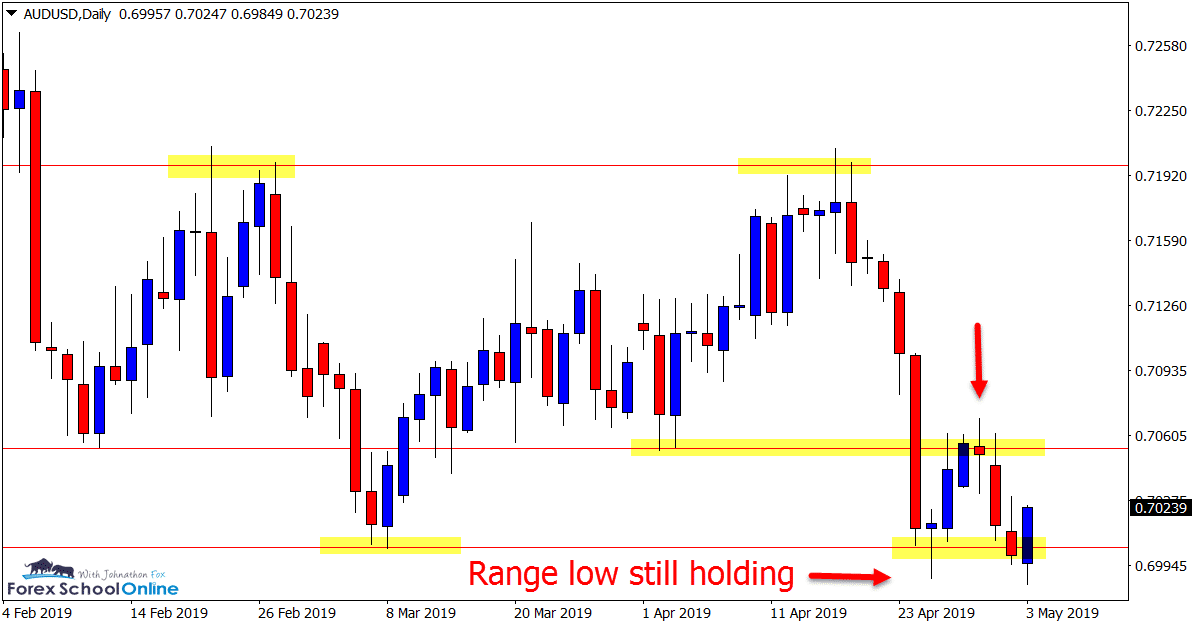
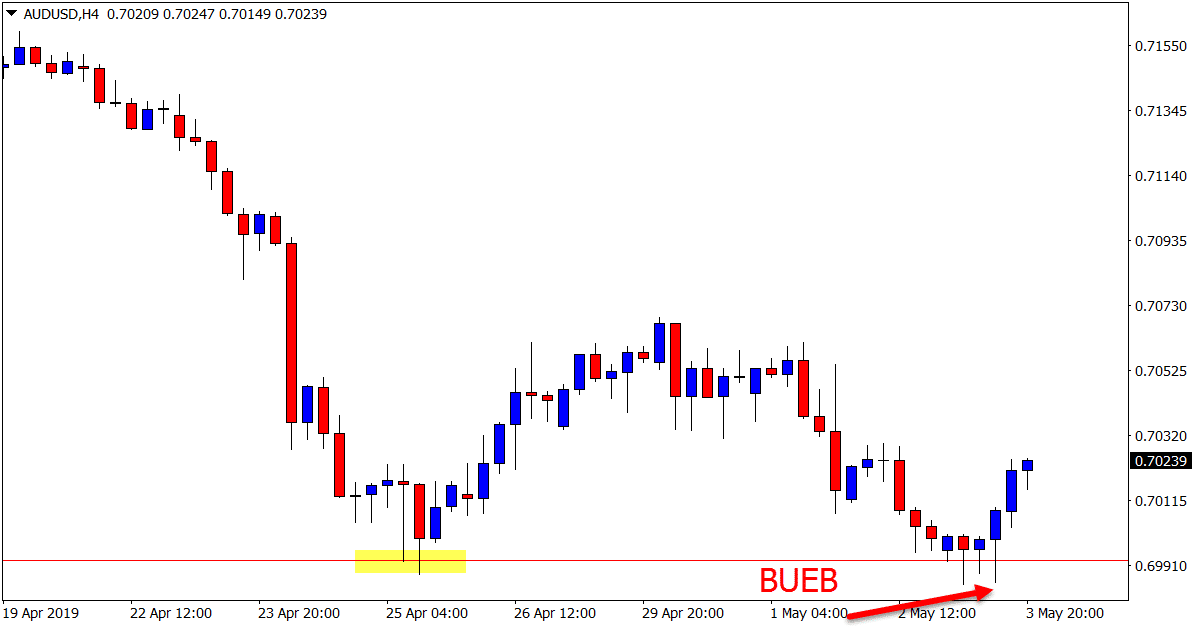
AUDUSD Daily and 4 Hour Charts
4 Hour Bullish Engulfing Bar
Price action on the AUDUSD is still holding at the lows of the range support we discussed in last week’s trade ideas.
After firing off the pin bar, price moved directly into the overhead resistance and has since been stuck in between the two levels.
We are now once again seeing a rejection of this range low with the 4 hour chart firing off a bullish engulfing bar = BUEB bumping price back higher.
Traders could watch both the swing high and swing low for potential trade setups in the coming sessions. As there is no trend, the market can be played either way, keeping in mind that a clear break of the range is far preferable.
Daily Chart
4 Hour Chart
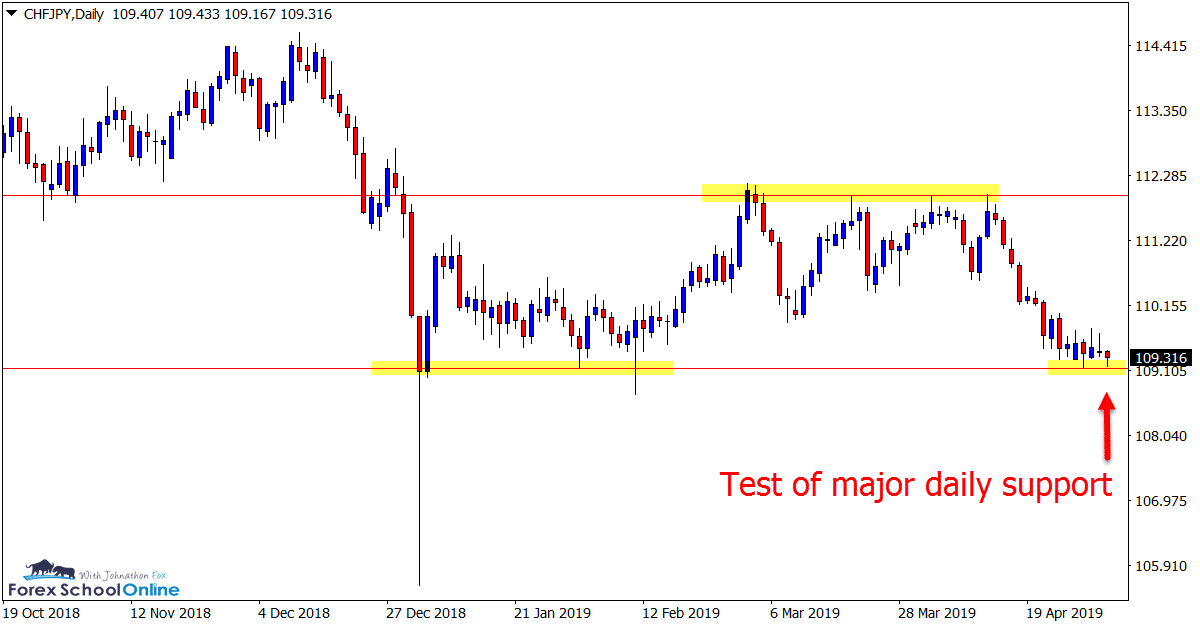
CHFJPY Daily Chart
Will Range Hold?
For the past six months price on the CHFJPY has been stuck in a sideways range with a clear high and low.
Along the way to forming this range there have been multiple false breaks and intraday false breaks of the major high and low.
As the daily chart shows below; price is now down at the major daily support making a fresh test.
Traders could watch this level for another false break and bullish trigger or, if price breaks lower, then look to make breakout and quick re-test trade setups.
Daily Chart
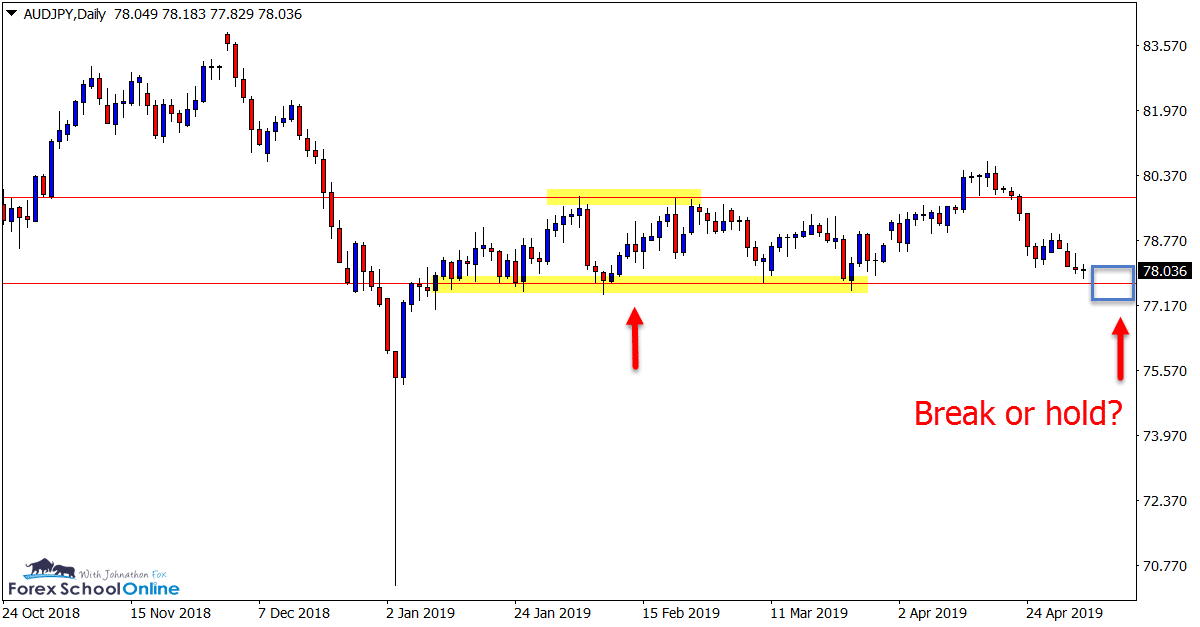
AUDJPY Daily Chart
Important Test of Support
Similar to the CHFJPY discussed above, the AUDJPY has been moving lower on the daily chart to make a new test of the major support level.
This looks to be a crucial level for this market, especially over the coming sessions.
If price holds at the support, then we could be in for more of the same trading conditions with price moving sideways and chopping along.
If however; price can break lower and through this level it could open the way for a lot more aggressive free flowing moves.
Checkout how to play quick breakout trades: Quick Breakout Trading Strategy
Daily Chart
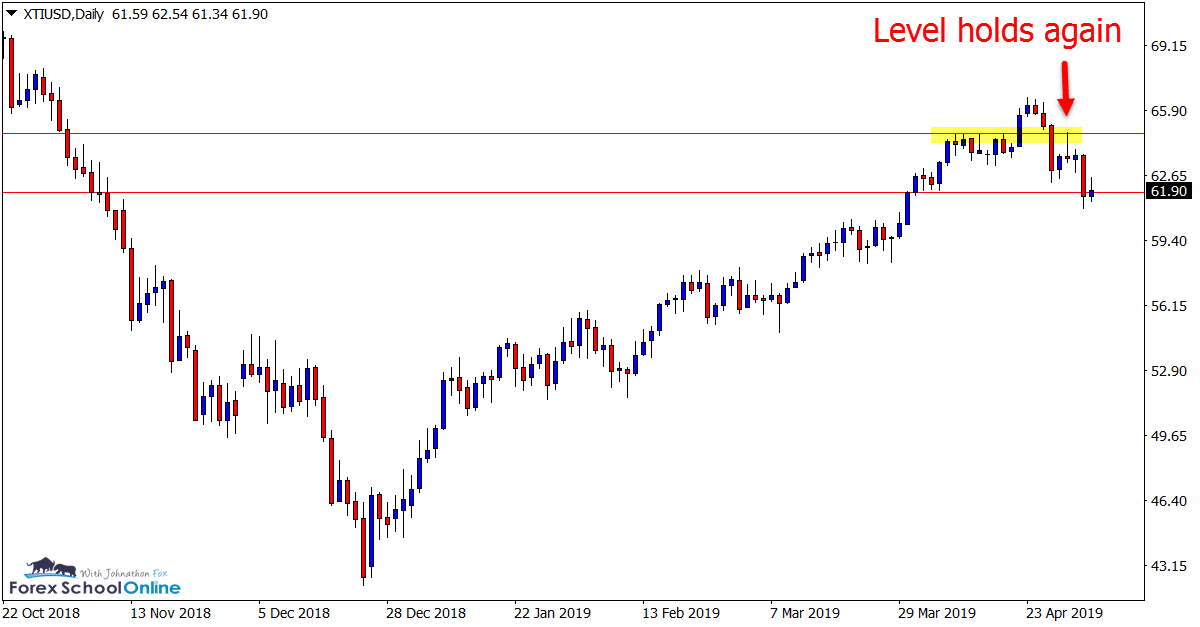
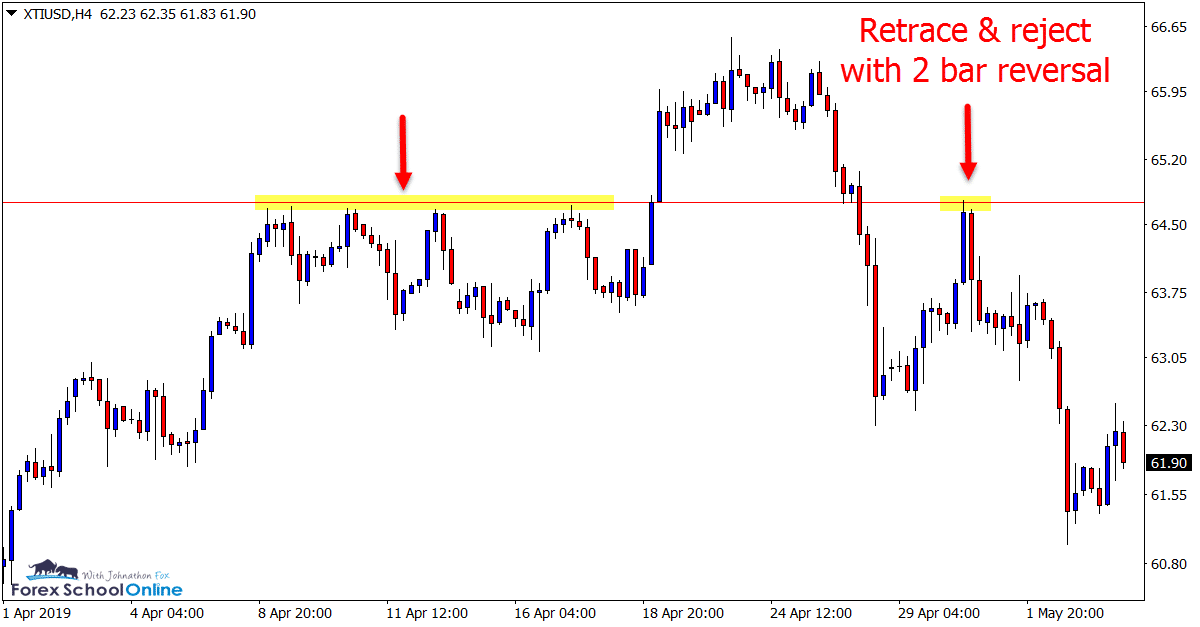
OIL v USD Daily and 4 Hour Chart
Price Flips at Resistance
In last week’s trade ideas we discussed this market and the two levels that were looking important for where price made its next move.
Whilst the trend higher has been free flowing, we have in recent times seen price snap lower.
Price did on the daily chart hold at support for a short while, but it quickly retraced into the overhead resistance and was rejected by the bears.
As the 4 hour chart shows below; this level was strongly rejected with a large bearish 2 bar reversal.
This resistance level stands in the way of any move higher continuing. If price can now break the recent swing support we could see a fast market reversal lower.
Daily Chart
4 Hour Chart
Charts in Focus Note: All views, discussions and posts in the ‘charts in focus’ are the view of Forex School Online and are not recommendations or trading advice. All posts are general in nature and are not advice to buy or sell.
Please leave questions or comments in the comments section below;

Leave a Reply