• Skip to primary navigation
  • Skip to main content
  • Skip to footer

ForexSchoolOnline.com

Learn to Trade Forex Online

  • Compare Brokers
    • Broker Type
      • Paypal Brokers
      • Swap-Free Brokers
      • Low Spread Brokers
      • ECN / STP Brokers
      • Market Maker Brokers
      • Non Dealing Desk Brokers
      • Low Minimum Deposit Brokers
    • Country
      • Brokers for Australia
      • Brokers for South Africa
      • Brokers for the UK
      • Brokers for the US
      • Brokers for Nigeria
    • Regulation
      • FCA Regulated Brokers
      • ASIC Regulated Brokers
      • FSCA Regulated Brokers
      • CFTC Regulated Brokers
    • Platform
      • MT4 Brokers
      • MT5 Forex Brokers
    • Strategies
      • Hedging Forex Brokers
      • Scalping Forex Brokers
      • Carry Trade Forex Brokers
      • Brokers for Indicators and EA’s
  • Start Here
    • Start Trading Guide
    • Beginner Trading Lessons
  • Free Forex Course
    • Public Login
    • Register
    • Password recovery
  • Lessons
    • Strategies
    • Videos
    • MT4 Guides
    • Money Management
  • Trade Setups
  • Tools
    • Correct Free Demo Charts
    • Forex Journal Download
    • Position Size Calculator
    • FULL List of Tools
    • Forex Demo Accounts
  • Price Action Guide
  • Free Course

WTI Oil Fires Off Double Time Frame Bearish Engulfing Bars | 6th Aug 2015

Johnathon Fox
08/07/2015 | UPDATED ON: 08/06/2019

A strategy we teach here regularly is for you to look to trade with the really obvious trend to stack the odds in your favor. Price on the WTI (West Texas Intermediate Oil market) has just fired off a great example with price printing 2 Bearish Engulfing Bar (BEEB) price action trigger signals on two different time frames.

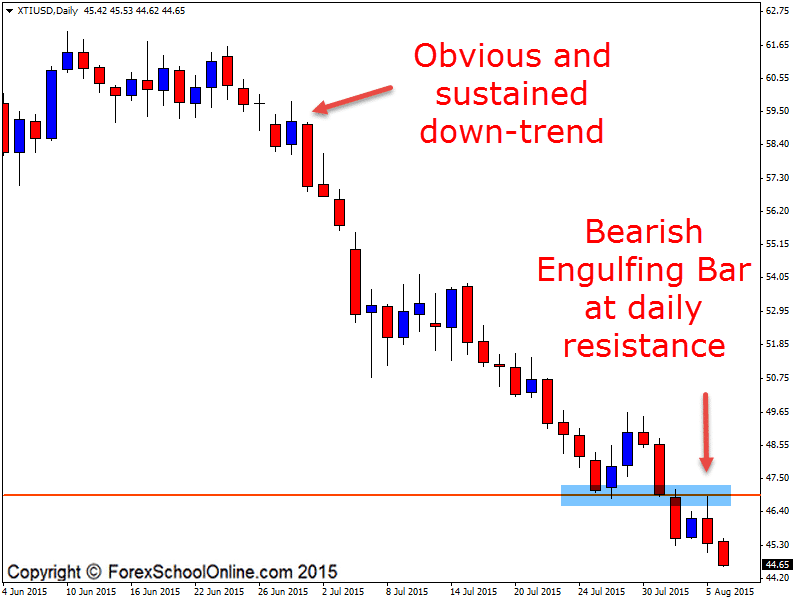
As the daily chart of this market shows below, price has been in a really strong trend; lower for some time, with price making really solid and obvious lower highs and lower lows.

When making up the members only market summary at the start of this week (the members market summary is something we make twice a week for members to show them where all the key levels, trends, price action setups, etc. are at that point in time), this was a market that stuck out for me as a market I had to include for members because of the trend and the potential for price to make a quick retrace back into the key daily level.

Trading with a really strong and obvious trend is one thing, but what makes price move is supply and demand, and more importantly, trading to and from the major supply and demand levels. We always need to be taking our trigger signals from areas of value and supply/demand or support/resistance. This is why this example on the Oil market is a great one to assess.

As I said at the start of the post, one of our most common strategies discussed is looking for pull-backs or rotations into and old support or resistance area. If we look at the daily chart of Oil here, we can see that price smashed lower with the strong trend and closed below the daily support level. When this happened, we can then start to look at the old support in order to flip from an old support to a new resistance level.

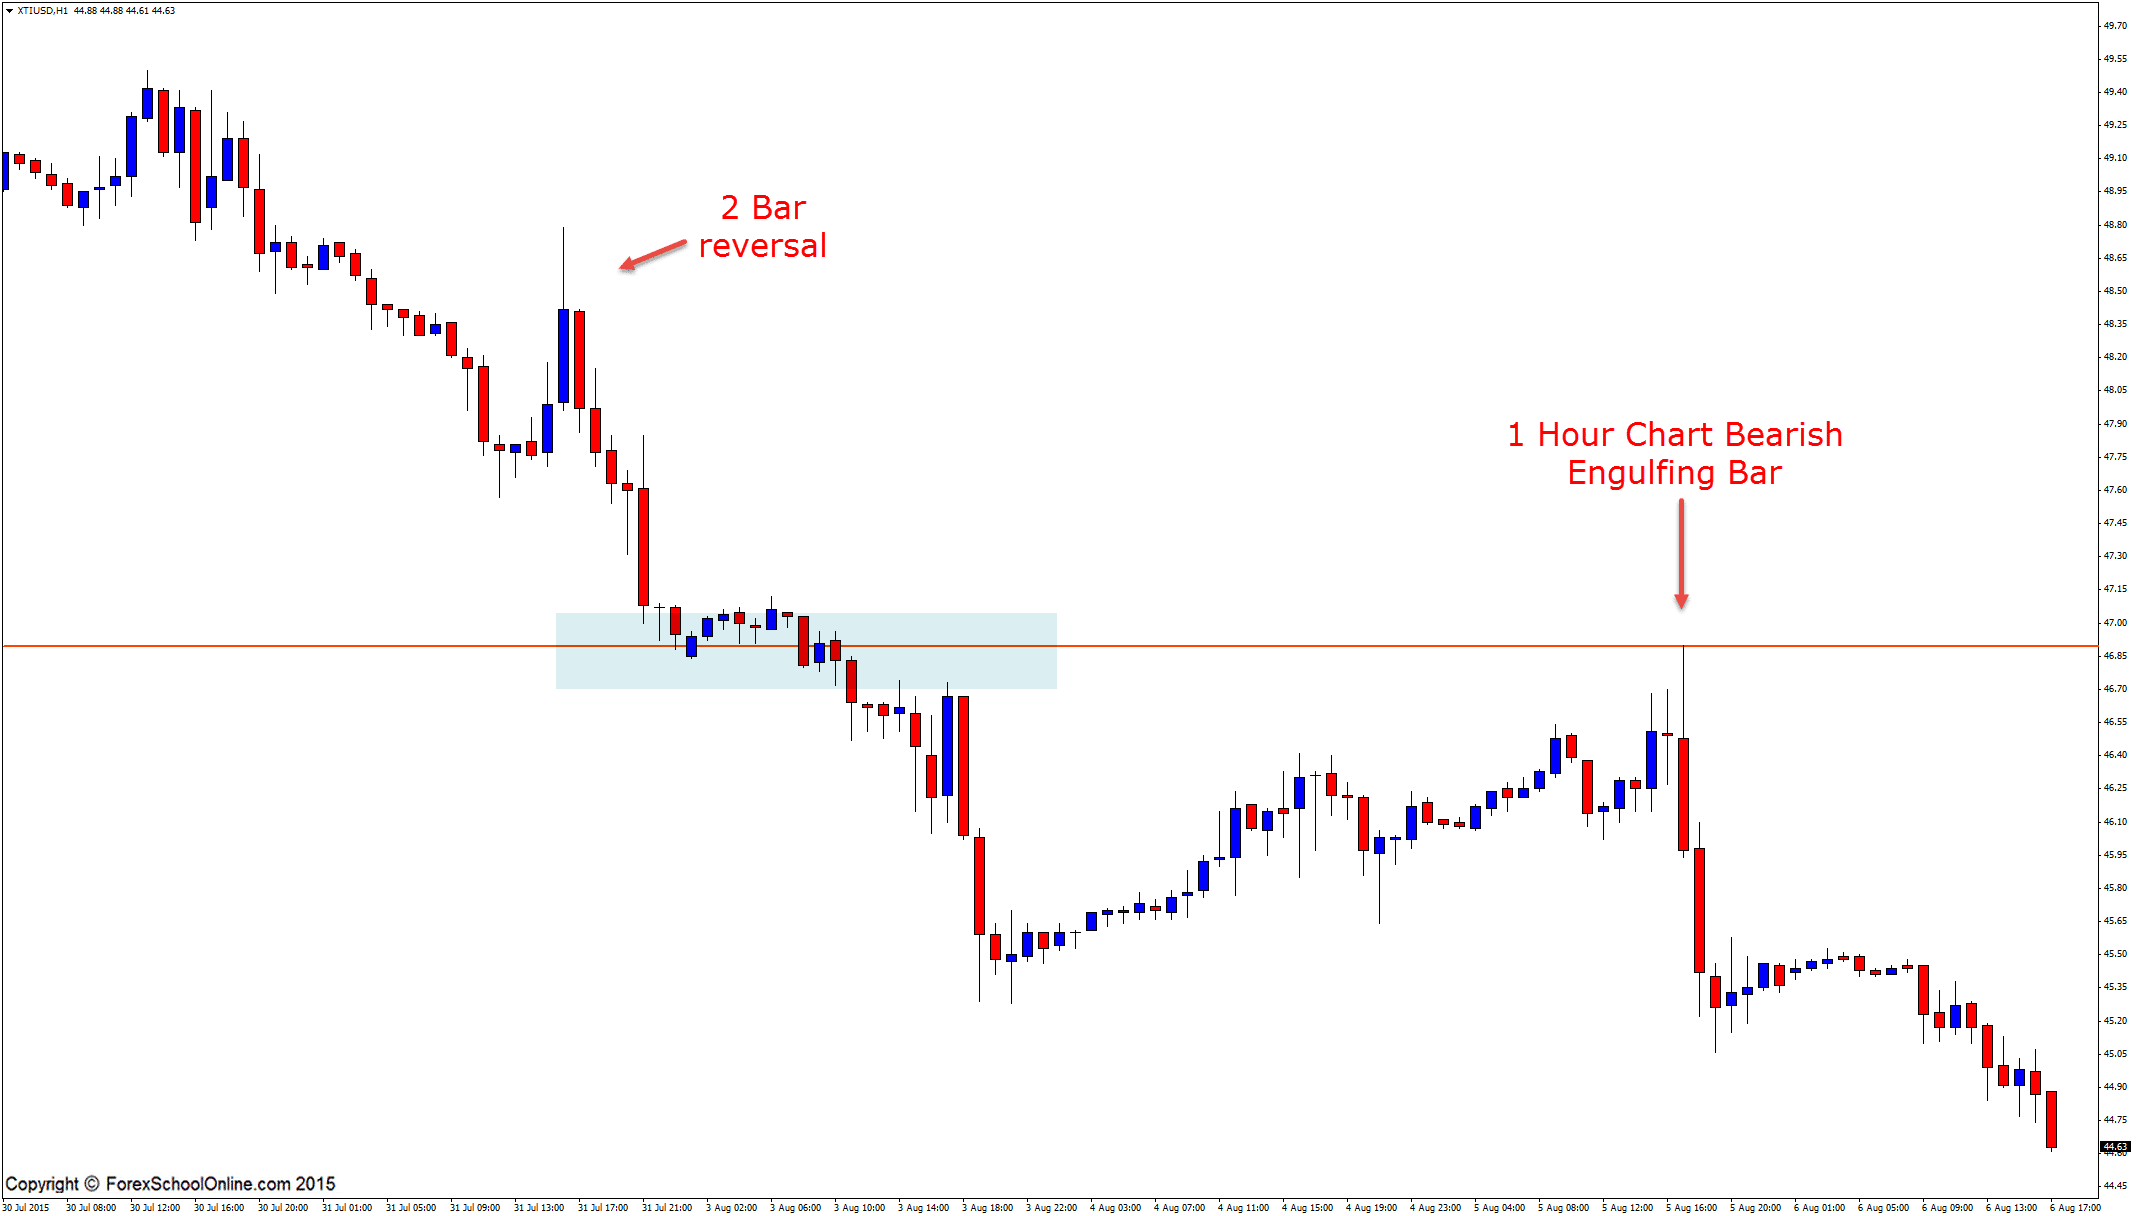
Once we know that price has “flipped”, we can begin to watch the new resistance level to see if price is going to make a quick retrace back into the old support and new resistance for potential short setups. Because the retrace is going to be a quick, short & sharp one (if it does happen), any potential trades we do take are going to have to be played on the smaller time frames, such as the 4 hour, 1 hour, or even lower time frames, just for the fact that there would not be enough space to make a trade on the daily chart, and the retrace is so quick that price would not be at a swing high for a reversal to be played.

On the chart below, you can see how price did make a really quick retrace back higher and into the 1 hour chart to form a really large and commanding Bearish Engulfing Bar. This BEEB was large, full of momentum, and also, closed right down near the lows, showing that the bears were right in control when price closes, which is a great sign. See the charts below for further explanations:


Daily Chart

WTI intermediate oil daily chart

1 Hour Chart

Oil 1 Hour price action engulfing bar


Related Forex Trading Education

– Learn How You Can Make Really High Probability Trades WITH the TREND

Recommended Broker

  • Broker
  • Min Deposit
  • Benefits
  • Score
  • Visit Broker

$200

T&Cs Apply
  • The Lowest Trading Costs
  • 50% Welcome Bonus
  • Award-winning 24 Hour Support
5
Trade Now FreeBets Reviews
Reviews

About Johnathon Fox

Johnathon is a Forex and Futures trader with over ten years trading experience who also acts as a mentor and coach to thousands and has written for some of the biggest finance and trading sites in the world.

View all posts by Johnathon Fox →
Previous Post: « AUDSGD Makes Huge Break For it Through Major Demand Level | 4th Aug 2015
Next Post: Trading Fear: The Exact Steps to Overcome »

Reader Interactions

Leave a Reply Cancel reply

Your email address will not be published. Required fields are marked *

Footer

Get Our FREE Course, Bonus Strategies & Indicators!
X
Join Us Now!

Your capital is at risk.

X

CORNERSTONE LESSONS

Forex Trading for Beginners

Price Action Trading

How to Trade Forex

Technical Analysis

Forex Charts

Forex Trading Strategies

Money Management 

Compare Brokers

Best Forex Brokers

Forex Demo Accounts

Best Forex Trading Platforms

Forex Apps

Swap Fee Accounts

MT4 Brokers

CATEGORIES

Forex Videos

Trading Lessons

Weekly Trade Ideas

Start Here Guide

ForexSchoolOnline.com helps individual traders learn how to trade the Forex market

WARNING: The content on this site should not be considered investment advice and we are not authorised to provide investment advice. Nothing on this website is an endorsement or recommendation of a particular trading strategy or investment decision. The information on this website is general in nature so you must consider the information in light of your objectives, financial situation and needs.

Investing is speculative. When investing your capital is at risk. This site is not intended for use in jurisdictions in which the trading or investments described are prohibited and should only be used by such persons and in such ways as are legally permitted. Your investment may not qualify for investor protection in your country or state of residence, so please conduct your own due diligence or obtain advice where necessary. This website is free for you to use but we may receive a commission from the companies we feature on this site.

We Introduce people to the world of currency trading. and provide educational content to help them learn how to become profitable traders. we're also a community of traders that support each other on our daily trading journey

Forexschoolonline.com is not a financial advisor. Do your research before investing your funds in any financial asset or presented product or event. We are not responsible for your investing results.

Copyright © Forex School Online Sitemap  - Privacy Policy - Disclaimers & Terms of Use - CONTACT US