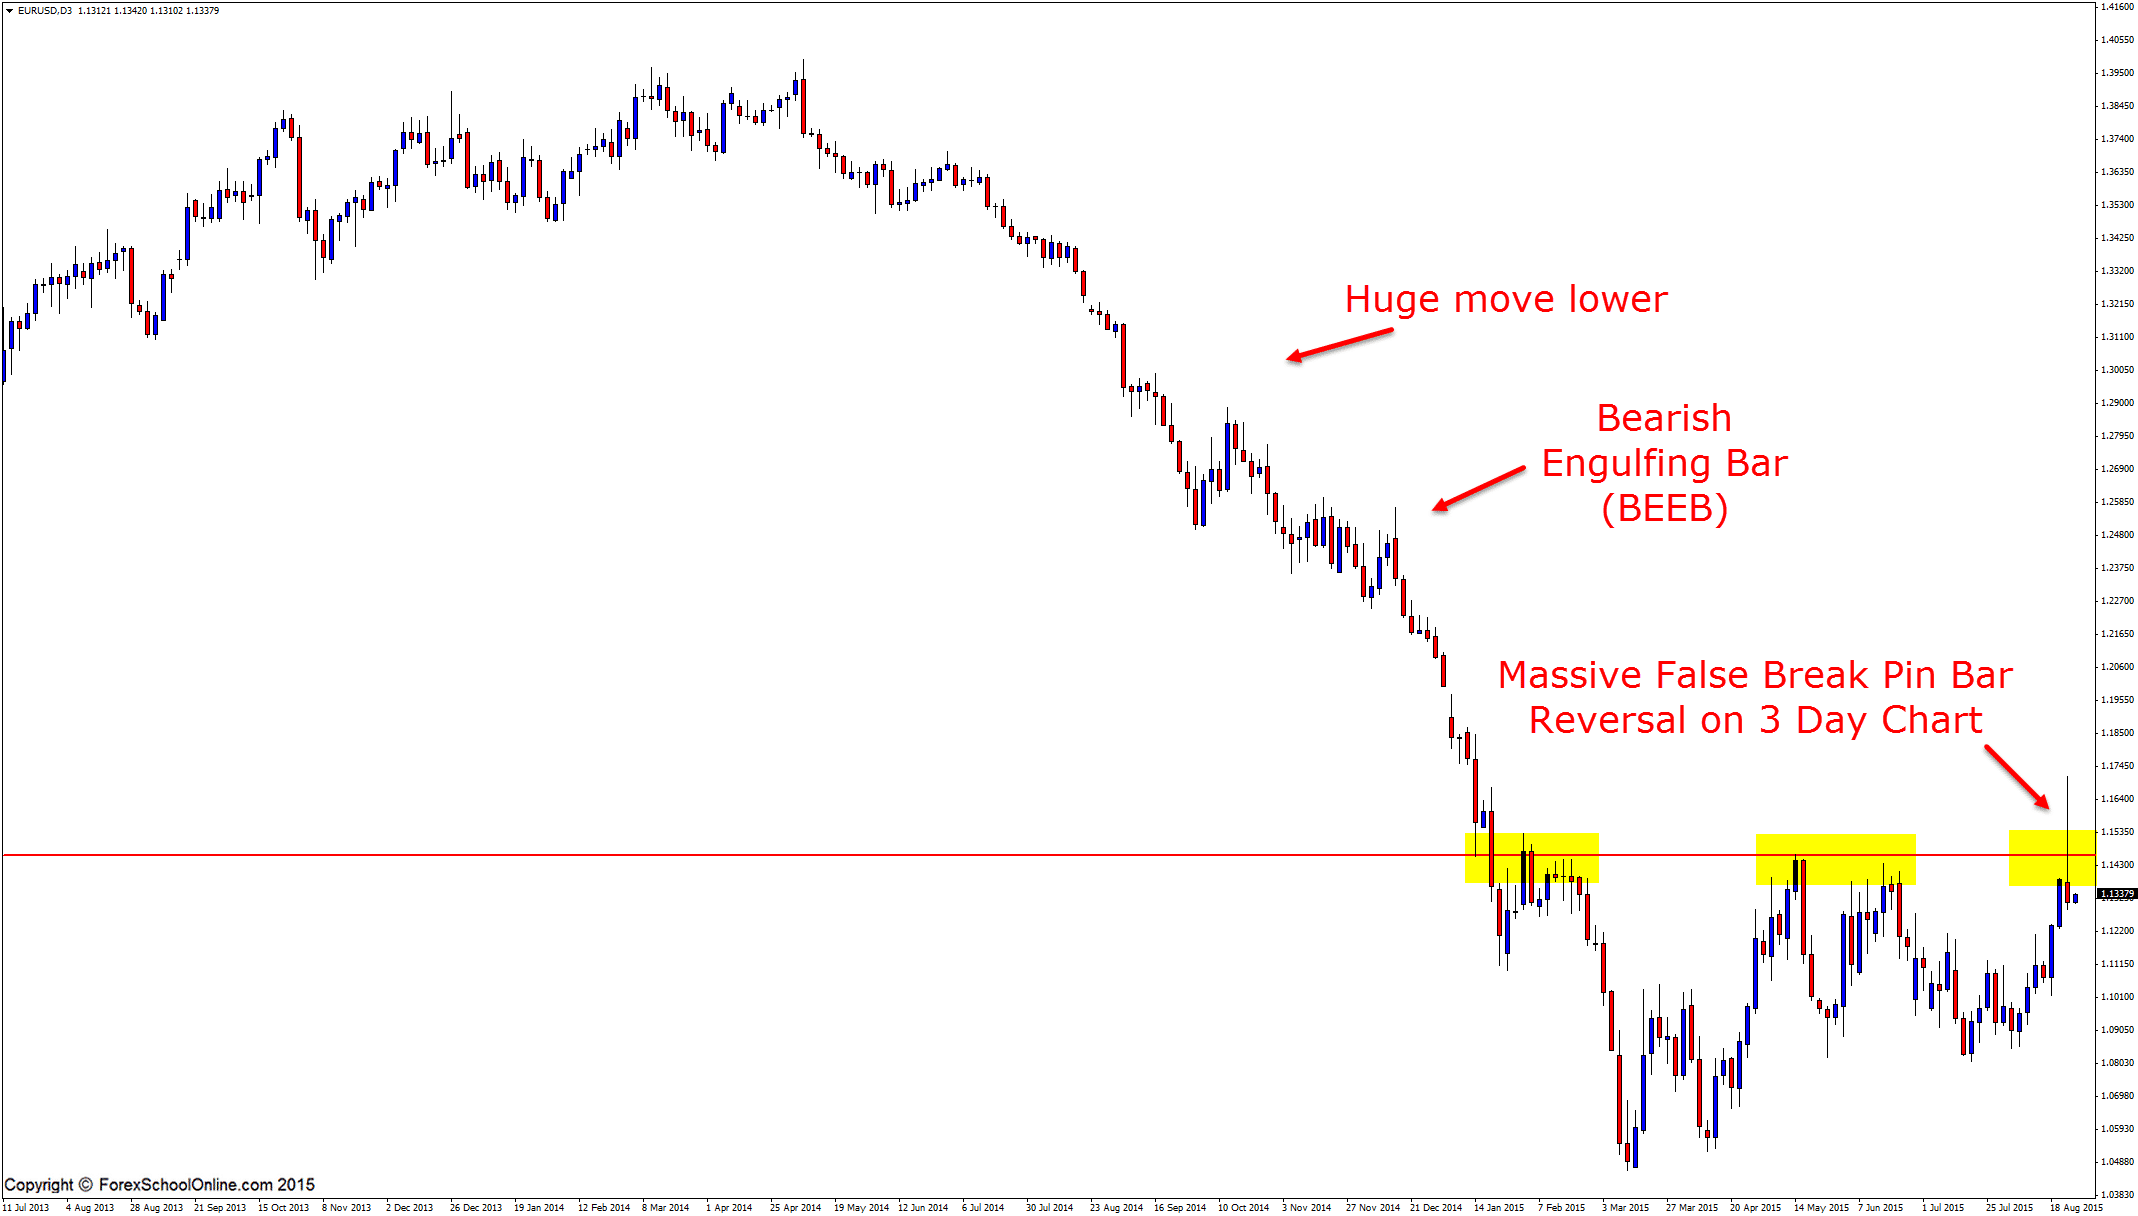
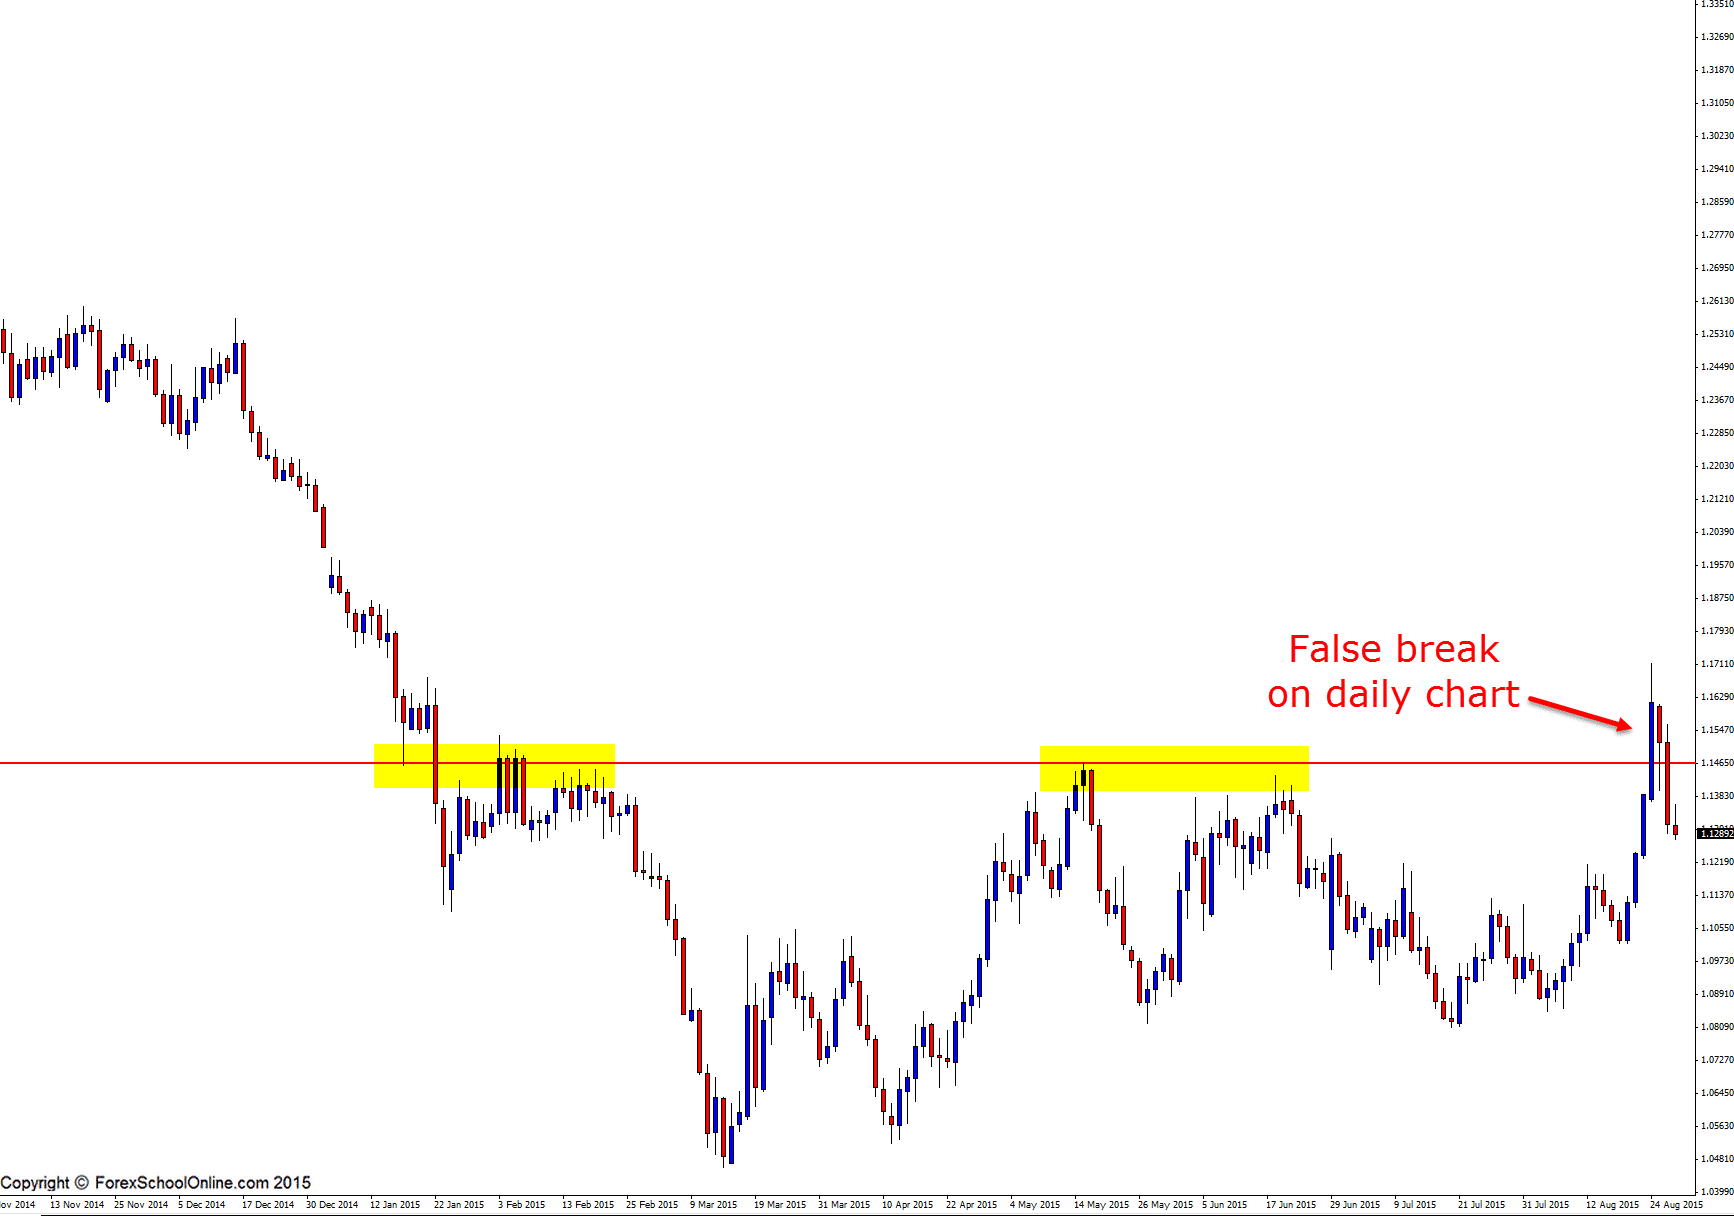
Price has fired off a huge false break pin bar reversal on the 3 day price action chart of the EURUSD. As the daily EURUSD chart shows below, price attempted to break above the major resistance level with a strong push higher before price quickly snapped back lower to complete the false break.
This is one of the many 3 day trade setups that are occurring at the present time with most of them first being pointed out and discussed between members in the members only forum this morning when they first formed. Other 3 day setups are setups such as the GOLD v USD, USDCHF & EURSGD to name a few.
The best false breaks are fast and aggressive and with the very strong amounts of volatility we have been experiencing throughout the market this past week, the market has been making regular false breaks.
False breaks occur when the major portion of the market gets going one way, only for price to snap back in another and stop all the traders trading in the original direction out. For example, using the EURUSD 3 day chart scenario, when price would have started breaking the resistance and moving out higher, this would have triggered a lot of traders into a lot of long trades, and a lot of traders would have also looked to take breakouts looking for the resistance to break.
These traders would get long and put their stops on the other side of the resistance. All it takes is something like traders to take some of their profits or in-balance in the order flow and price starts to change directions and all of a sudden, instead of a breakout, we have a fakeout, and this happens QUICKLY.
The reason the fakeout happens quickly is because all the traders who looked to get long and looked for the breakout; in other words, the portion of the market who got going in the wrong way, now are a sitting duck and all have their stops lined up ready to be taken out. As price starts to move back lower, it starts to eat these stops quicker and quicker like fuel to the fire until it hits the next area of support.
You can look to hunt really high probability false break trade setups on all time frames from the higher time frames, such as the 3 day chart, right down to the smaller time frames. What is super important is WHERE you make the trade from, the PRICE ACTION STORY, and HOW YOU MANAGE THE TRADE.
You can watch a video on a super high probability false break pin bar trade I made here:
False Break High Probability Pin Bar Video
If this false break on the EURUSD breaks, there is a close first area around the 1.1209. If price can break that close first area, there is then space below that. If price makes a move back higher, then the major daily resistance would be the key level to keep a really close eye on for any price action plays.
Special Note: MT4 is the platform that I have always been asked to write a guide for! I have now released a beginners guide on how to use MT4. If you want to start using MT4, but don’t know how or you use MT4, but you want to be better, then read the new FREE beginners guide here: Beginners Guide to Trading Price Action With MT4
3 DAY CHART

DAILY CHART


Leave a Reply