GBP/USD Price Prediction – May 24
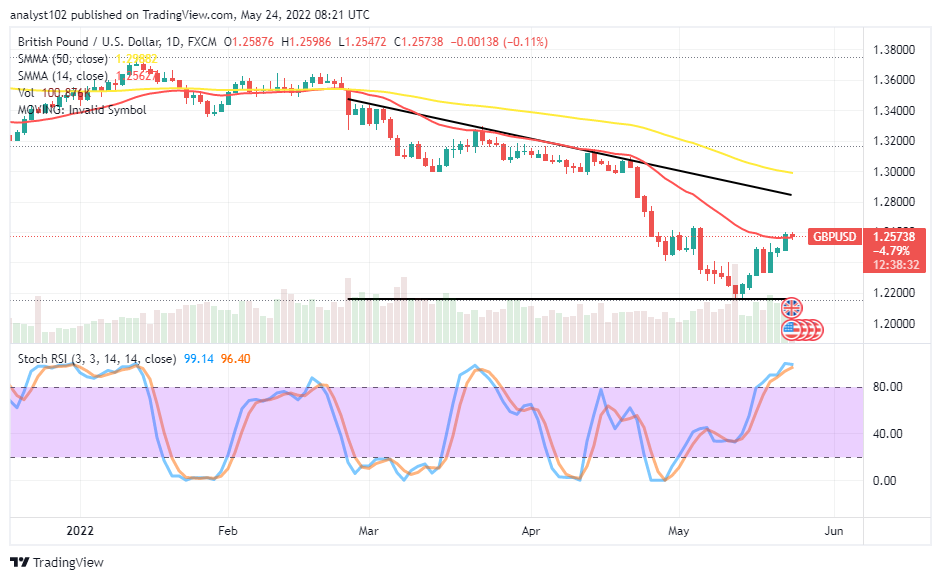
It is gathering that the GBP/USD market price tends to run back into a decline as it has been trying to cultivate a push past a psychological point around the 1.2600. Price has traded between 1.2598 and 1.2547 value lines at a minimal percentage of 0.11 negative.
GBP/USD Market
Key Levels:
Resistance levels: 1.2700, 1.2900, 1.3100
Support levels: 1.2400, 1.2200, 1.2000
GBP/USD – Daily Chart
The GBP/USD daily chart reveals the currency pair price tends to run back into a decline as there has been an overbought reading condition in the current market’s trading outlook. Price has reached the trend line of the 14-day SMA from the beneath as the 50-day SMA is above it. The Stochastic Oscillators have penetrated the overbought region deeply, giving a signal countering the probability of getting more stable ups in the subsequent trading sessions. Will the GBP/USD market push past above the 1.2600 level sustainably soon afterward?
Technically, it indicated the GBP/USD market appears; unable to be pushed above the 1.2600 level sustainably soon afterward as the price is trading under an overbought-trading condition. Based on that, it will require long-position placers and a lot of effort to make headway at the current point of trading to achieve a continuation in its recently embarked recovery move.
On the downside of the technical analysis, the GBP/USD market may have to brace up for another round of significant drawdown, as it did happen a couple of sessions back around the 1.2600 level. The stage appears to get set while a bearish candlestick eventually emanates, pushing down through the penultimate bullish candlesticks around the trend line of the 14-day SMA to consider launching a sell order.
Summarily, the GBP/USD market traders may now have to be on the lookout for an active correctional movement around the 1.2700 resistance level to be able to sight a decent selling order position entry in the long-term run. GBP/USD 4-hour Chart
The GBP/USD medium-term chart reveals the currency pair price tends to run back into a decline as it has touched a higher resistance around the bearish trend line drawn. The 14-day SMA indicator has moved northward to conjoin with the 50-day SMA indicator. The Stochastic Oscillators have crossed southward from the overbought region. And they are still pointing toward the south direction to indicate the possibility of trending back downward.
Note: Forexschoolonline.com is not a financial advisor. Do your research before investing your funds in any financial asset or presented product or event. We are not responsible for your investing results.


Leave a Reply