• Skip to primary navigation
  • Skip to main content
  • Skip to primary sidebar
  • Skip to footer

ForexSchoolOnline.com

Learn to Trade Forex Online

  • Compare Brokers
    • Broker Type
      • Paypal Brokers
      • Swap-Free Brokers
      • Low Spread Brokers
      • ECN / STP Brokers
      • Market Maker Brokers
      • Non Dealing Desk Brokers
      • Low Minimum Deposit Brokers
    • Country
      • Brokers for Australia
      • Brokers for South Africa
      • Brokers for the UK
      • Brokers for the US
      • Brokers for Nigeria
    • Regulation
      • FCA Regulated Brokers
      • ASIC Regulated Brokers
      • FSCA Regulated Brokers
      • CFTC Regulated Brokers
    • Platform
      • MT4 Brokers
      • MT5 Forex Brokers
    • Strategies
      • Hedging Forex Brokers
      • Scalping Forex Brokers
      • Carry Trade Forex Brokers
      • Brokers for Indicators and EA’s
  • Start Here
    • Start Trading Guide
    • Beginner Trading Lessons
  • Free Forex Course
    • Public Login
    • Register
    • Password recovery
  • Lessons
    • Strategies
    • Videos
    • MT4 Guides
    • Money Management
  • Trade Setups
  • Tools
    • Correct Free Demo Charts
    • Forex Journal Download
    • Position Size Calculator
    • FULL List of Tools
    • Forex Demo Accounts
  • Price Action Guide
  • Free Course

Has Silver Broken Lower On the Daily Chart Again? | 31 Oct 2014

Johnathon Fox
10/31/2014 | UPDATED ON: 08/06/2019

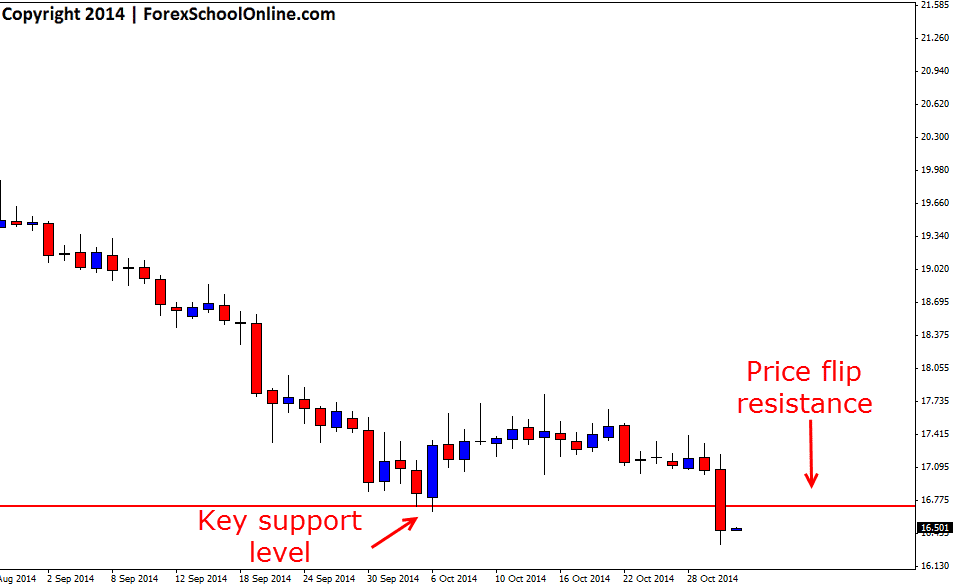
Silver (XAGvUSD) has now broken and importantly closed lower below a key support level on the daily price action chart. Silver in recent times has been in a strong down trend on the daily chart and this move through the daily support level confirms the continuation of the trend lower with the new lower low being formed.

Those traders who have followed this blog for a while now will now that there is only one way to play clear and obvious trends and that is to trade with them and look for trades in the same direction. Many traders are burnt every single day looking to trade from the extreme highs and lows against obvious trends and whilst there can be the optimum times to take counter trend trades, when price is in an obvious trend, it gives us a great chance to increase our odds of making a winning trade just by trading with it and not against it.

As the daily chart shows below; this daily support level that price has now busted through could act as a very solid spot to look for price to retrace back higher into and to then look to hunt for short trades on intraday charts such as the 8 hour, 4 hour or even lower time frame charts. This old demand level that price has moved through could become a new price flip area and new resistance, but traders would need to watch the price action and how the price action behaves. For any potential trades at this new resistance level there would have to be a high probability bearish trigger signal such as the ones taught in the Forex School Online Price Action Courses.

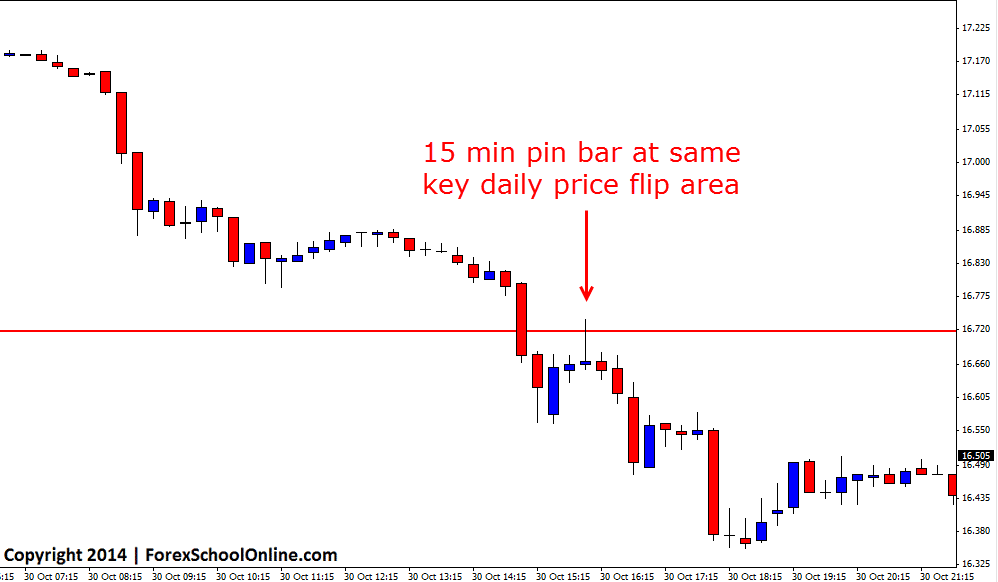
As the second 15 minute chart shows below; this price flip level has already acted as a first test resistance level and held up. As so often happens when a key daily level breaks; price will break through the level and then make a quick re-test before rejecting and continuing on. In this case, price broke through lower, made a quick retrace back higher and then fired off a 15 minute pin bar rejecting the key daily resistance before then continuing back lower.


Daily Silver Chart

Silver has broken lower in daily chart


15 Minute Silver Chart

15 Minute XAUUSD Price Action Chart


Related Forex Trading Education

– First Test Support/Resistance Price Action Trading Strategy

Recommended Broker

  • Broker
  • Min Deposit
  • Benefits
  • Score
  • Visit Broker

$200

T&Cs Apply
  • The Lowest Trading Costs
  • 50% Welcome Bonus
  • Award-winning 24 Hour Support
5
Trade Now FreeBets Reviews
Reviews

About Johnathon Fox

Johnathon is a Forex and Futures trader with over ten years trading experience who also acts as a mentor and coach to thousands and has written for some of the biggest finance and trading sites in the world.

View all posts by Johnathon Fox →
Previous Post: « USDZAR Fires Off 2 Bar Reversal at Daily Price Flip Level | 30 Oct 2014
Next Post: US Tech 100 Hits New Yearly High in Strong Breakout | 4th Nov 2014 »

Reader Interactions

Comments

  1. Johnathon Fox says

    11/13/2014 at 10:52 AM

    Hello Vincent,

    great questions.

    Once we start to notice a major daily level break we need to start watching the price action on the smaller charts to see what it is doing. If price has broken lower and then made a re-test back higher we need to be watching this and what the price behaviors are.

    It depends what time frames you are up to trading and looking for your trades on. If you are looking for your trades on the 4hr or 8hr chart, then you will have a lot longer to wait because you are going to need to see price break away and then come back to form enough of a swing point that there is space to trade back into, but if you are trading the 1 hour – 15 minute charts, then you need to be watching price after it has broken a key level because it will often make a quick retracement and then continue. This will all happen and be inside the one daily candles makeup.

    Think of your question from an order flow perspective; the level can only have a first test the first time over all time frames. Think about the example I give with the bulls and the bears in the trading lesson and each time a level is tested a little bit of each side is taken away so no matter what the time frame a each test a little bit of bulls/bears are taken away from the key level. Does this make sense? Sometimes price will break and go right on through and sometimes price will break and make a first test, but you can only have one first test, that is not to say the level is not going to be a great one again.

    Johnathon

    Reply
  2. Vincent says

    11/12/2014 at 2:45 AM

    Hi Johnathon,

    In this post you’ve shown the M15 fires off a quality pinbar before the level actually breaks on the D1 chart, which basically means the 30th daily candle is still in the process of forming when the M15 signal comes in. My question is that is it possible to look for a PA signal on the lower timeframes even before the D1 candle closes through the level? I thought we should only look for a FTR in this case only right after the level breaks on the D1 chart, which means 31st of October in this case.

    And also since M15 already made a quick re-test on this level and dropped, is it still possible to look for another FTR in the H1 / H4 / H8 timeframe? Hope to hear from you soon.

    Regards, Vincent.

    Reply
  3. TTF says

    11/05/2014 at 4:17 PM

    Hi,

    I’m wondering if you took that PB on M15 because I thought you would only trade 1H and above…

    Regards

    Reply
    • Johnathon Fox says

      11/05/2014 at 10:41 PM

      Hello TTF,

      I did not personally take this setup, however I do at times trade the 15 minute time frame.

      Once you have become profitable on the higher time frames and worked your way down, it is not so much about the time frame as it is the price action and the story and what is going on. I discuss that here; https://www.forexschoolonline.com//trading-daily-chart-price-action-strategies-down-to-intraday/

      Johnathon

      Reply

Leave a Reply Cancel reply

Your email address will not be published. Required fields are marked *

Primary Sidebar

Forex School Online

High Probability Price Action Trading

How to make, manage and take profit from trades in the markets

Start Learning (It's Free!)

Turn Your Trades into Winners!

The Price action course is the in-depth advanced training on assessing, making and managing high probability price action trades.

Sign up for Free!

Recommended Broker

  • Broker
  • Min Deposit
  • Benefits
  • Score
  • Visit Broker

$200

T&Cs Apply
  • The Lowest Trading Costs
  • 50% Welcome Bonus
  • Award-winning 24 Hour Support
5
Trade Now FreeBets Reviews
Reviews

Footer

Get Our FREE Course, Bonus Strategies & Indicators!
X
Join Us Now!

Your capital is at risk.

X

CORNERSTONE LESSONS

Forex Trading for Beginners

Price Action Trading

How to Trade Forex

Technical Analysis

Forex Charts

Forex Trading Strategies

Money Management 

Compare Brokers

Best Forex Brokers

Forex Demo Accounts

Best Forex Trading Platforms

Forex Apps

Swap Fee Accounts

MT4 Brokers

CATEGORIES

Forex Videos

Trading Lessons

Weekly Trade Ideas

Start Here Guide

ForexSchoolOnline.com helps individual traders learn how to trade the Forex market

WARNING: The content on this site should not be considered investment advice and we are not authorised to provide investment advice. Nothing on this website is an endorsement or recommendation of a particular trading strategy or investment decision. The information on this website is general in nature so you must consider the information in light of your objectives, financial situation and needs.

Investing is speculative. When investing your capital is at risk. This site is not intended for use in jurisdictions in which the trading or investments described are prohibited and should only be used by such persons and in such ways as are legally permitted. Your investment may not qualify for investor protection in your country or state of residence, so please conduct your own due diligence or obtain advice where necessary. This website is free for you to use but we may receive a commission from the companies we feature on this site.

We Introduce people to the world of currency trading. and provide educational content to help them learn how to become profitable traders. we're also a community of traders that support each other on our daily trading journey

Forexschoolonline.com is not a financial advisor. Do your research before investing your funds in any financial asset or presented product or event. We are not responsible for your investing results.

Copyright © Forex School Online Sitemap  - Privacy Policy - Disclaimers & Terms of Use - CONTACT US