High Probability Trading: Finding A+ Trade Setups
When most traders first start trading they are not looking to make high probability trades and they are not looking to create an edge over the market.
I sure know I wasn’t.
I was looking for how I could make winning trades and a lot of them. However; after enough losses and enough lessons from the market, it soon becomes clear that unless the trades I was placing had a higher probability of winning than losing, I would continue to get flogged.
What is High Probability Trading?
Wikipedia does not do a great job of explaining in simple terms what high probability is. The basic definition is; something that occurs with a higher probability than something else.
Something that has a 60% chance of working out is a higher probability outcome because it has a higher chance of working out.
A simple example of this maybe a tennis player who gets 80% of their first serves into play. This player has a high probability chance of getting their next first serve into play.
Probabilities are just that; probable. They are not definite or guaranteed and this is why traders must use money management and risk control, ie; never bet the farm on any one trade.
High probability trading refers to the likelihood of whether a trade will win or not.
Making high probability trades is crucial for a successful trader because no matter how great the trader is, they will have losing trades. This is a fact. The market will move in unexpected ways and losses will happen.
Traders can create an edge over the market and they can do this by making trades that have high probabilities. The best way to do this is by stacking the odds in your favor with each trade you play.
Using Forex Supply and Demand
When traders first start out trading, they are often amazed at how price respects the same levels time and again, over and over.
Price may not have touched a level for 20 years, but it will still often find support or resistance at the same level that it had in the past.
Why is it that support and resistance works so well? And, why is it that so many traders around the world, from all the major banks to the biggest professional traders, all use support and resistance?
Support and resistance works because of supply and demand and order flow. It is the base for high probability A+ price action trades.
Just the same as supply and demand affects the price in the real world from everything such as gas to the price of an apple, support and resistance also works the same way.
Below is an image showing how the market is made up of two teams, the buyers, who are known as the bulls, and the sellers, who are known as the bears. This is the same in real life.
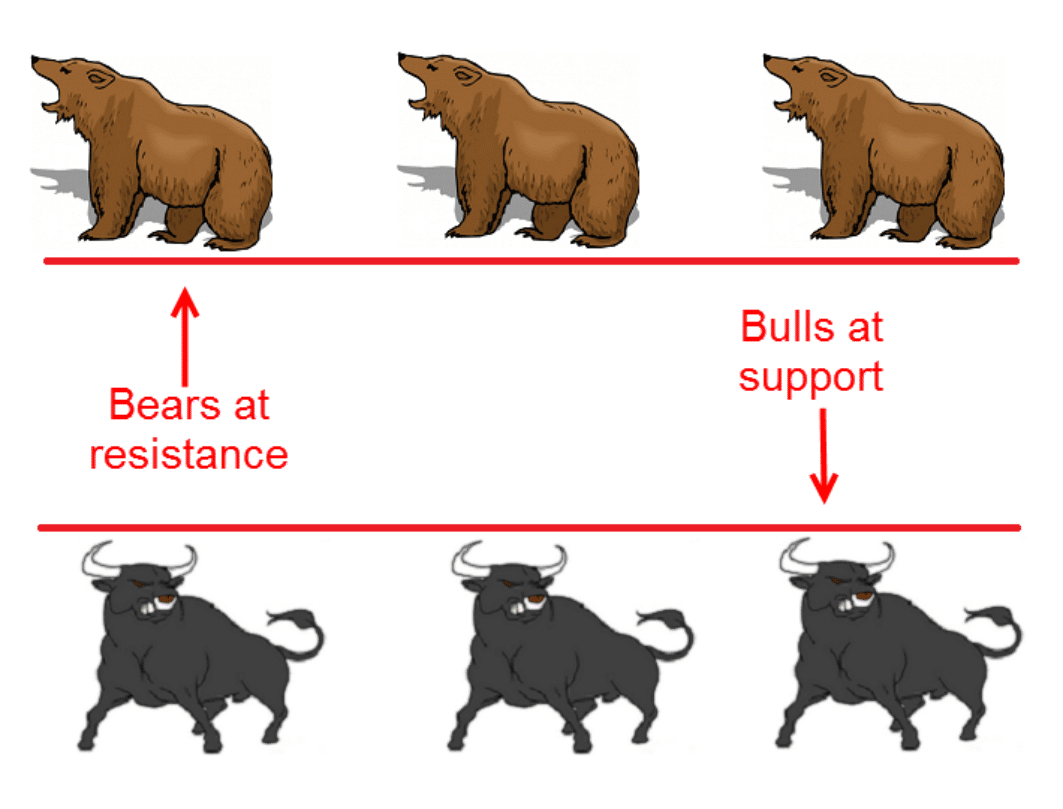
In life, we are constantly buying and selling things, and hustling for better prices, it’s just that in the Forex market, we are doing it online really quickly and can see it unfold with live prices.
Support and resistance is used from the biggest of the biggest guys in the world, such as the bank’s, the trading organizations and brokers, right down to the smallest retail traders, and everyone in between.
It is literally used by almost everyone and that is what makes it so POWERFUL.
But, it also allows you to make trades on both the higher and smaller time frames.
How to Use Your Support and Resistance Levels
For the resistance level to hold, the bears (the sellers) will need to be stronger than what the buyers (bulls) are.
This is the constant struggle in the Forex markets, but let’s get back to our original question; why do the same price action levels tend to hold?
If we think of the market as I have just explained it, and we think of the many different participants, each time a support or resistance level comes into play, there is a fresh wave of orders trading the support or resistance level.
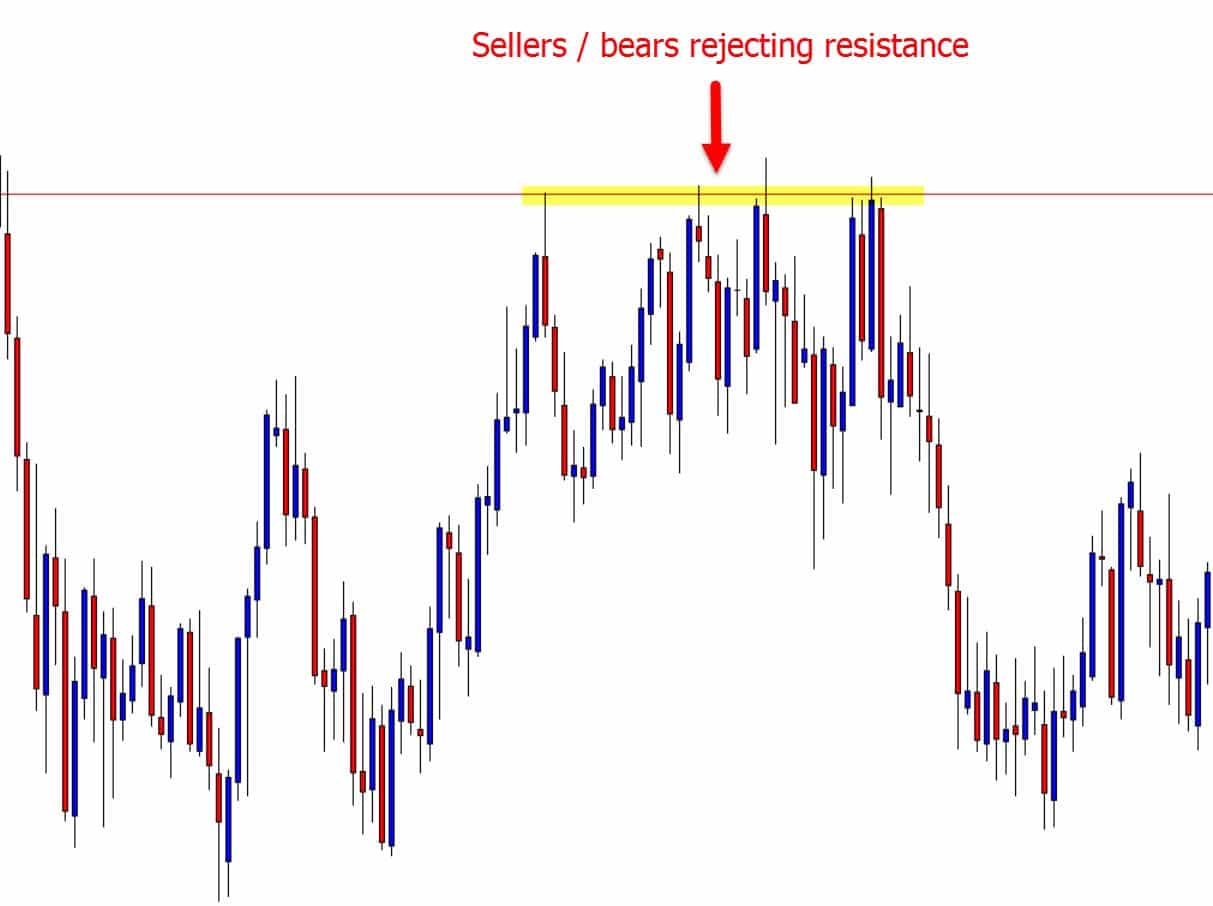
For example, if there is a really obvious resistance level, then a lot of people are going to look to enter short bearish trades, looking for the resistance level to hold.
This resistance level then cannot break until the bulls / buyers take over and clean out the bears / sellers.
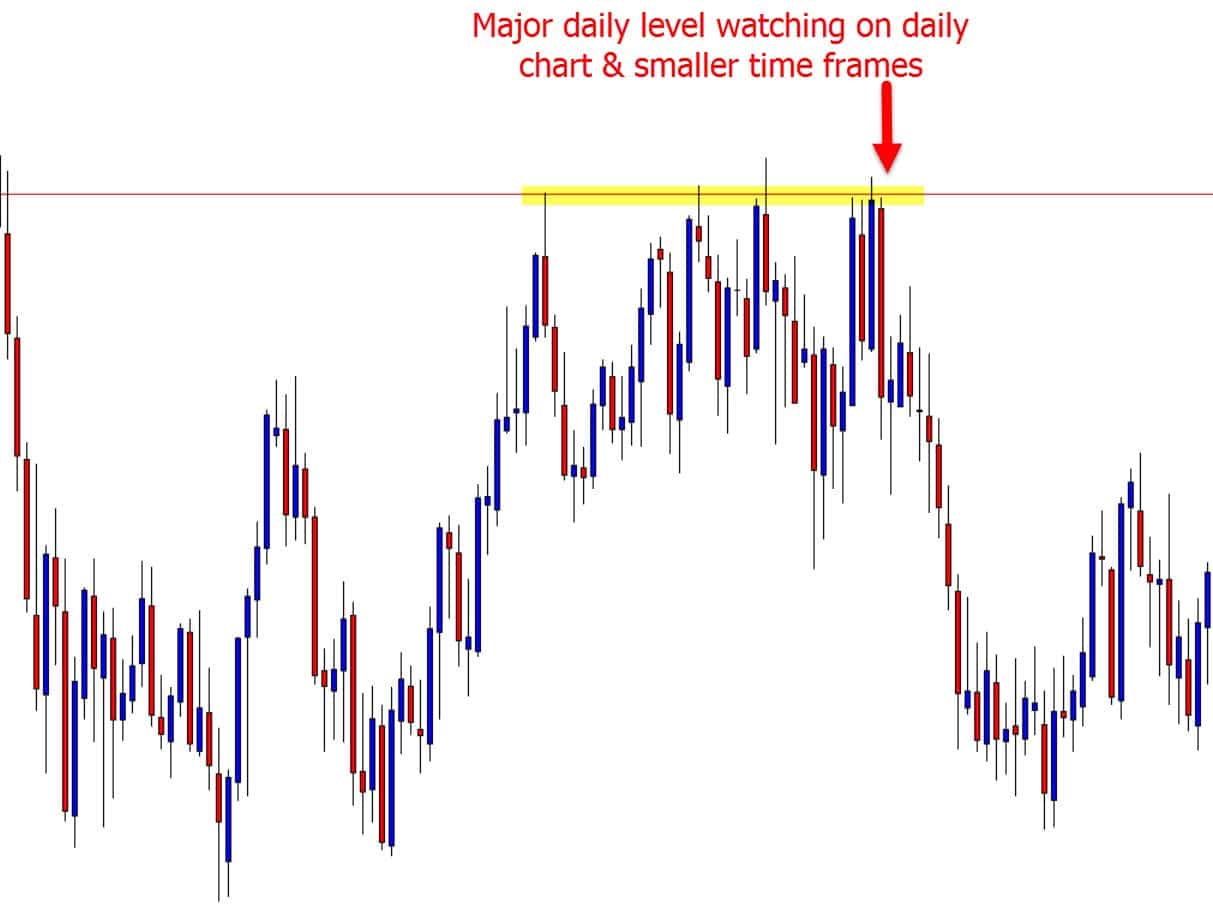
Marking Your Important Levels
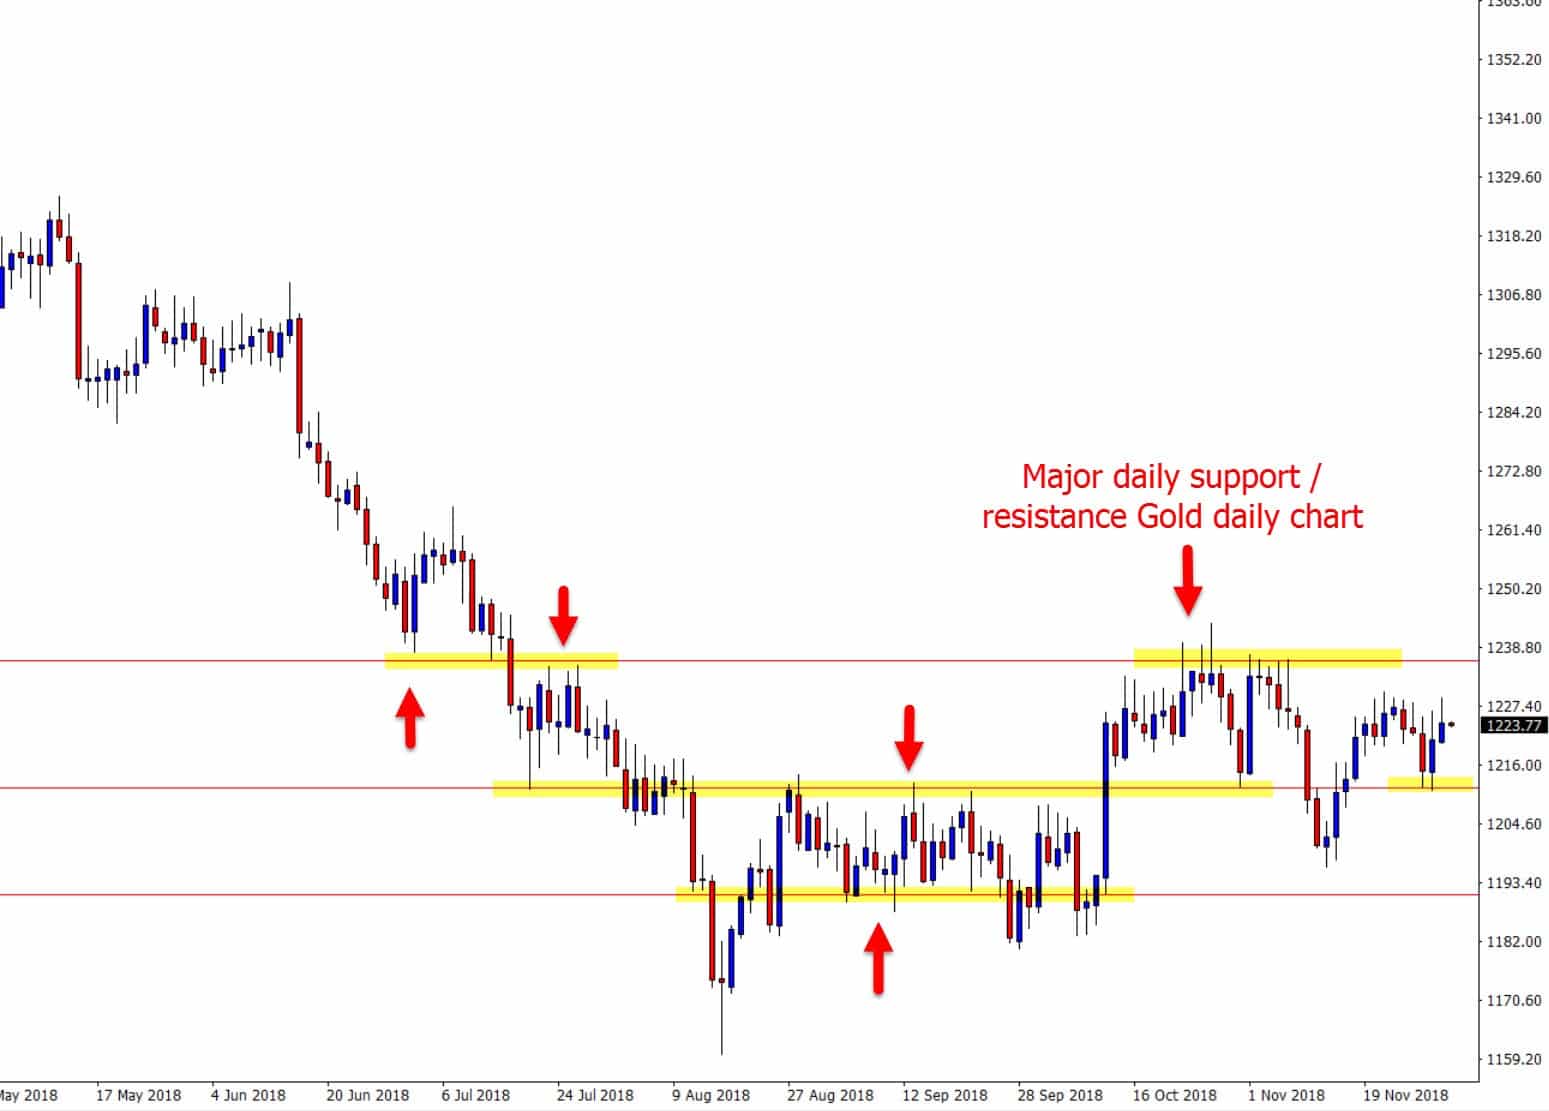
If you are hunting your trade setups from the daily chart, and then using the daily charts major levels to find your trigger signals, it means you will always be assured of using major support and resistance levels that you know the rest of the market is also keeping a close eye on.
If however, you start going down to the intraday charts, such as the 4 hour, 1 hour, or even lower, and then finding support and resistance, you run the huge risk of making trades from really weak and insignificant levels.
You also run the risk of making trades in ‘no man’s’ land and potentially trading into what could be a strong daily level.
Below, I go through the exact routine of how you want to be doing this, so that you can both have the highest probability setups, and also, cut it down to the smallest amount of time possible going through your charts.
What you want to make sure though, is that when you are picking your levels on the daily chart, you are only picking levels that you actually want to make trades at.
For example, when you mark your daily chart, don’t go marking 10 levels; just plot the major levels you actually want to hunt trades at. You can market profit targets and stop loss levels if and when you find a trade.
If there is no where you would like to find a trade, then don’t mark any levels and move to the next chart.
Read an in-depth lesson on how you can use this strategy in your trading at;
Ultimate Guide to Marking Support and Resistance
How to Find A+ High Probability Trades
We all want to be able to make A+ trades and do it in the smallest amount of time possible so that we don’t have to sit in front of a screen all day. The key to doing that is in the way you go about marking up your key support and resistance levels, and after that, how you go about hunting your trades during the week.
There is a really good way that can speed up the amount of time it takes you to go through your charts and to hunt for trades.
There is also another way that literally, at the end of the week, takes hours extra.
The fast, logical, and efficient way is based around marking support and resistance levels on the daily charts and having a clear, set routine. A step-by-step run through of this routine can be found at Daily Forex & Futures Routine
The routine to find the best setups and cut out hours of wasted time starts Sunday night or anytime over the weekend you have time, as long as it is before the market opens.
You go through all your charts and mark up your major daily support and resistance levels, remembering that you are ONLY marking the major and obvious levels that you would like to hunt for trades at, should price move into it.
Once you have your support and resistance levels plotted, it is then just a matter of during the week, following the market, and adjusting them as price moves.
You will be looking for price to move into your levels, so you can hunt A+ trade setups.
Once price breaks one of your levels, you can then reassess and mark a new level.
As we will discuss in just a moment, you can look for trades on smaller time frames a lot quicker and without going through a ton of charts wasting your time using the preparation work you have already put in.
Trading the Daily and Intraday Charts
The reason you have marked your levels on a daily chart is so that no matter what time frame you go to, whether it is a 15 minute time frame or staying right on the daily chart, you know that the support or resistance level is a major level.
You don’t get down to the smaller intraday time frames, and then get into trouble because you are playing trades from weak levels. As already discussed at length, the major levels are where the major supply and demand points are, and that is where the bulls and bears have the biggest battles for control.
This next part of the routine is super important to your week and super important to either how long you spend looking at your charts and how much time you have for other things you want to spend time on.
A lot of traders get this part wrong and in turn, it costs them because they sit in front of their computer for far too long!
A lot of traders wait for every 8 hour candle close, every 4 hour candle close, and every 1 hour candle close.
When these candles close, they go to their charts on either their MT4/MT5 and then they go through each individual pair, looking for a trade setup, one by one.
A trader doing it like this may have anywhere from 30-60 pairs and markets in which they are watching for setups, so each time a candle closes, they have to go through every single pair and look for a potential setup.
You could imagine how long this takes if they are going through 60 pairs individually and potentially 10 times or more per day (which a lot of traders do).
What they would be far better off doing is using the routine we are discussing above.
The simple reason for this is; even if the trader does find a trade trigger, they still need to then look for a compelling support or resistance level to back up the trigger signal. They may have found the trigger first, but there is no key level.
How to Trade With Speed and Super High Probability
The major risk a trader faces when finding trades this way is that now they have found the trigger first.
Will their mind try to convince them that there really is a solid level there to make a trade when the level is not a solid one at all? This is a very risky way of doing it because the price action story is king.
To speed up your routine, what you should be doing is monitoring the major levels that you have marked on your daily charts.
What you are watching for is when price gets close to one of your major levels.
When price does approach, you are then looking for an A+ high probability trigger signals that you can use to enter a trade.
Using this method and routine, rather than having to check every single candle close every 1/4/8/12 hours, all you have to do is watch your major daily levels that you are wanting to take trades from, keeping in mind that on some charts, you will not want to make any trades because they will be to messy.
You will simply be able to flick through from daily chart to daily chart and see if price has reached one of your “Hot Zones” or not.
You do not have to go to every candle close, analyze the candle to see if it has formed a trigger, and if it has, try and find a suitable level.
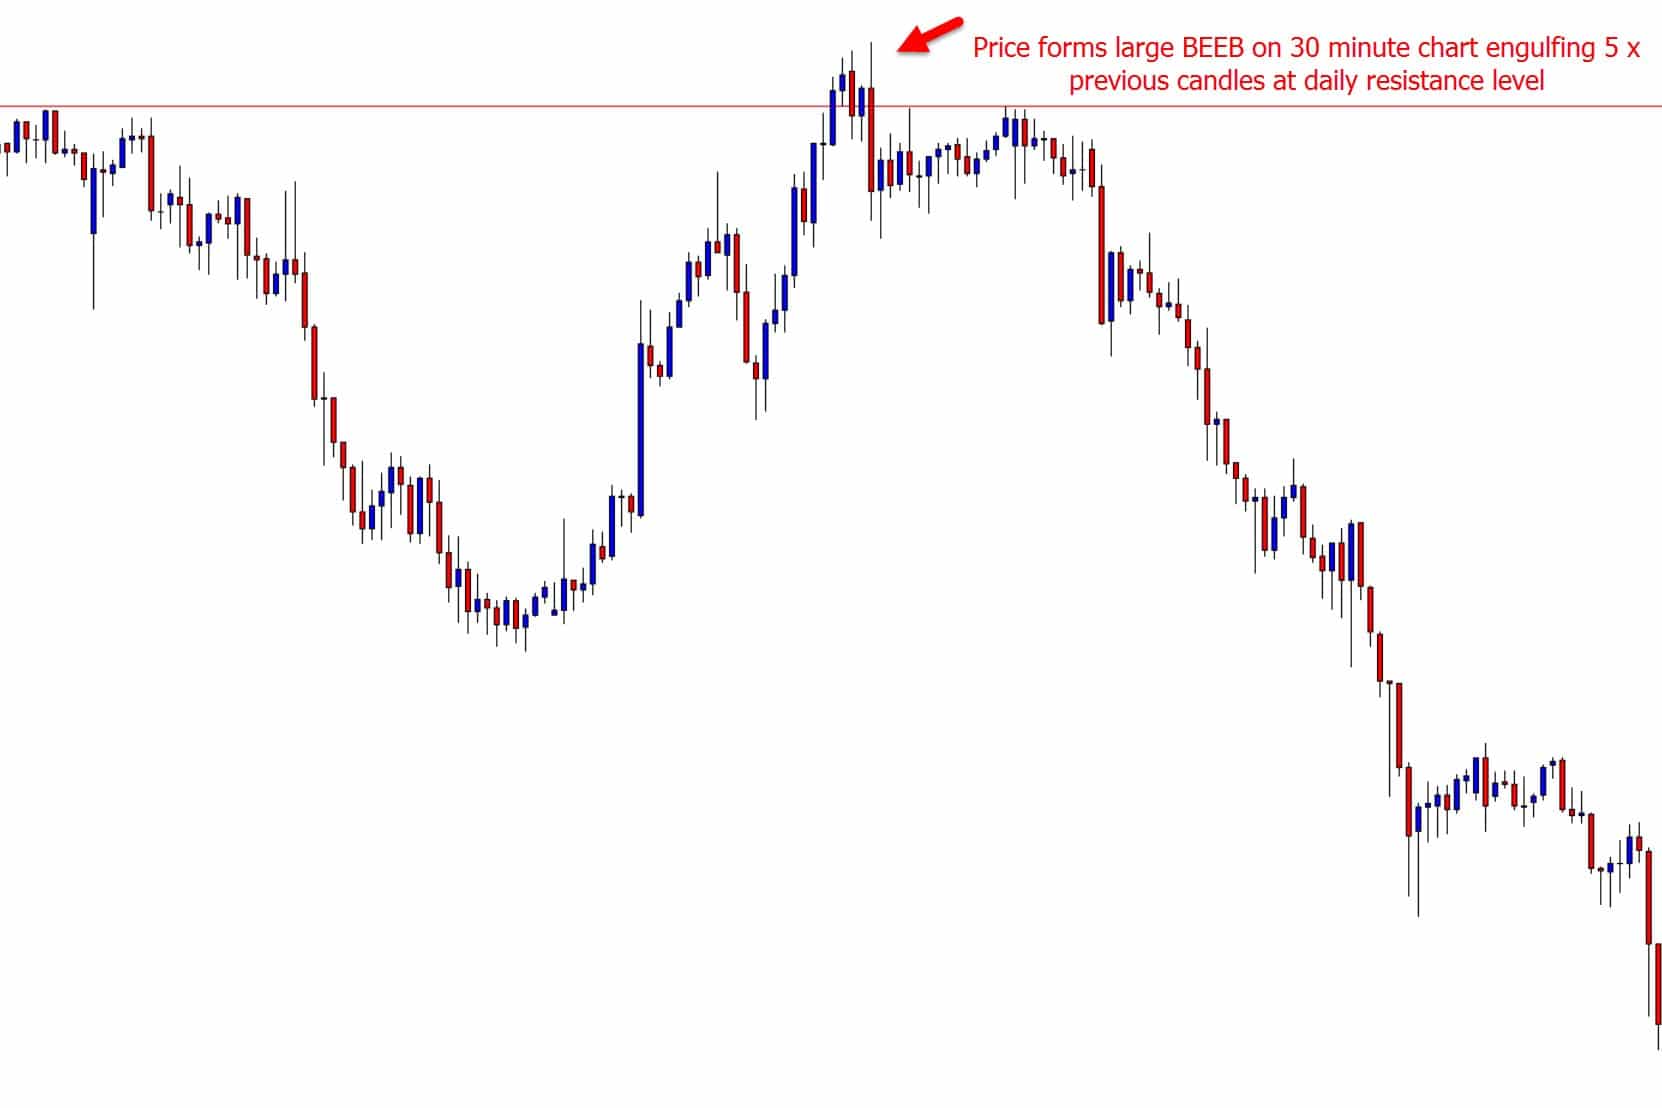
Chart example below shows price forming a Bearish Engulfing Bar on 30 minute chart using the same daily chart level as daily chart above.
NOTE: You do not have to trade smaller time frames and can trade the daily charts only. However, using this routine and finding A+ trades in this method allows you to trade many markets and time frames.
The good thing about this method is that you can also set price alarms to make it even easier on yourself so you don’t have to be at the computer all the time.
For example, you have a really solid daily chart level you have been watching and don’t want to miss out on, but are going out.
You can use your MT4 or MT5 charts to send you a price alert to your phone or email and tell you when price has got close to your level or broken it. Pretty cool huh!
Last Thoughts
Making high probability trades is more than just entering trades. It is your whole mindset and trading preparation.
Using this strategy to set up your routine and find A+ trades not only are you going to cut down on a heck of a lot of time, but when you do make trades, you are going to know that they are from major daily levels.
The price action story is king. Once you have found the best story that stacks the odds in your favor, finding the entry becomes confirmation.
This lesson has taken some explaining, but it is more than worth it because it can save you a heck of a lot of time in front of the charts.
The best thing you can do is to start implementing this information with your demo account and start looking for high probability trigger signals at the major support and resistance points.
You can get a free correct New York Close demo account HERE.
Safe trading,
Johnathon
Leave you comments and questions in section below;

Before coming across this great article, i used to jump in the market and forcing the market to give me trade opportunities. Now this article has opened my eyes I’m starting to see the light.
#FOREX SCHOOL ONLINE IS A GREAT SCHOOL
Thank you so much JOHNATHON FOX
Hi Johnathon
I went through your article and I am overwhelmed. I just have one for you to answer; there is this strategy that is called, “Top down analysis” how do approach this?
thanks in advance