MANTRA (OMUSD) Price Forecast: February 13
OMUSD‘s price is currently running a bullish race and remains stable at the moment. The price might touch the $0.3500 resistance level as the crypto is facing high pressure from the bulls. Thus, a sharp breakout and closure above the previous high of $0.3489 value will invalidate any bearish thesis and the price might hit the high at the $0.3500 resistance level and beyond, resulting in sustainable growth and the best crypto signals for the coin holders.
Key Levels:
Resistance Levels: $0.3200, $0.3300, $0.3400
Support Levels: $0.0180, $0.0170, $0.0160
OM (USD) Long-term Trend: Bullish (Daily Chart)
The MANTRA pair is moving in a bullish direction on the higher time frame. The price might touch the $0.3500 resistance level soon as it faces high pressure from the bulls at the moment.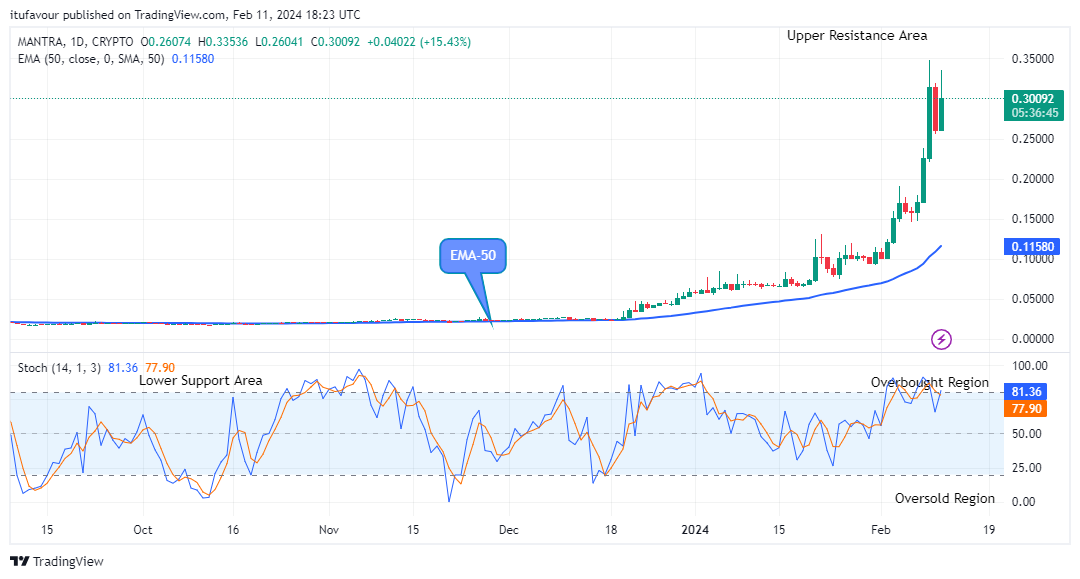
The Bulls are trying not to fall this time around. Further, the coin prices are traded above the EMA-50, this confirms a bullish trend.
The coin price found resistance at the $0.3486 value above the moving averages after a series of dip lows in the previous action; this has made it possible for the coin to remain in a bullish trend zone in its recent high.
After completing the dip lows at the $0.2557 low value during yesterday’s session, the bulls made an increase to the $0. 3353 supply value above the EMA-50 shortly after the daily chart opens today.
This indicates that the buy investors are dealing in the coin investment. Therefore, if the bulls could increase their tension in the market, the price action might touch the $0.3486 supply value which will enable the bulls’ recovery to foster a higher price resulting in an intraday gain for buyers.
Additionally, the OMUSD price is also pointing upwards on the daily stochastic, this suggests that the coin price may likely continue in an upward direction and this might touch the $0.3500 supply trend line soon in its higher time frame.
OM (USD) Medium-term Trend: Bullish (4H Chart)
Upward pressure still dominates the OMUSD pair in the medium time frame. The coin price which is above the supply level might touch the key levels at the overhead resistance soon. Buyers are confident about gaining higher levels and this confirms their high impact in the market at the present. 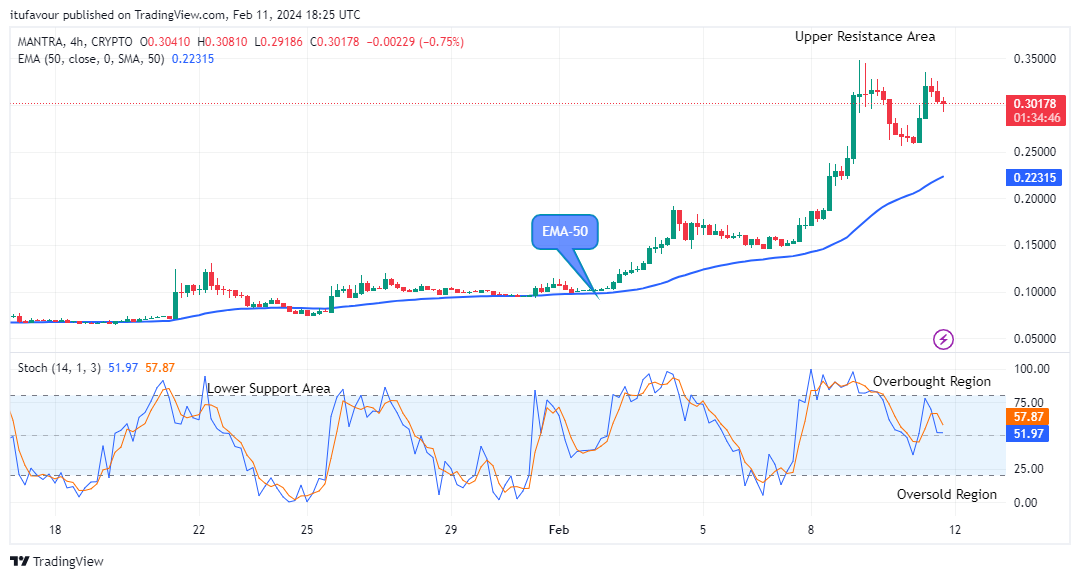
The bulls’ pressure to the $0.3278 supply level in the previous session has made it easier for the coin to remain in an uptrend in its recent price level.
The price drop to the $0.2918 support value above the EMA-50 as the 4-hour chart opens today has not stale the bull run as it remains in an uptrend.
Thus, if the buyers eventually wrestle trend control from sellers and rebound from $0.3278 support, a breakout and touch at the $0.3486 resistance trend line is needed to confirm the potential Bull Run.
In addition, more upsides are still coming as shown by the stochastic oscillator pointing upwards to indicate an uptrend. With the look of things, the bullish rally might touch the $0.3500 high value in no long time in the medium-term time frame.
Buy MANTRA on Longhorn
Learn to Trade Forex Online
MANTRA (OMUSD) Price Might Touch the $0.3500 Resistance Level
Footer

ForexSchoolOnline.com helps individual traders learn how to trade the Forex market
WARNING: The content on this site should not be considered investment advice and we are not authorised to provide investment advice. Nothing on this website is an endorsement or recommendation of a particular trading strategy or investment decision. The information on this website is general in nature so you must consider the information in light of your objectives, financial situation and needs.
Investing is speculative. When investing your capital is at risk. This site is not intended for use in jurisdictions in which the trading or investments described are prohibited and should only be used by such persons and in such ways as are legally permitted. Your investment may not qualify for investor protection in your country or state of residence, so please conduct your own due diligence or obtain advice where necessary. This website is free for you to use but we may receive a commission from the companies we feature on this site.
We Introduce people to the world of currency trading. and provide educational content to help them learn how to become profitable traders. we're also a community of traders that support each other on our daily trading journey
Forexschoolonline.com is not a financial advisor. Do your research before investing your funds in any financial asset or presented product or event. We are not responsible for your investing results.
Leave a Reply