• Skip to primary navigation
  • Skip to main content
  • Skip to primary sidebar
  • Skip to footer

ForexSchoolOnline.com

Learn to Trade Forex Online

  • Compare Brokers
    • Broker Type
      • Paypal Brokers
      • Swap-Free Brokers
      • Low Spread Brokers
      • ECN / STP Brokers
      • Market Maker Brokers
      • Non Dealing Desk Brokers
      • Low Minimum Deposit Brokers
    • Country
      • Brokers for Australia
      • Brokers for South Africa
      • Brokers for the UK
      • Brokers for the US
      • Brokers for Nigeria
    • Regulation
      • FCA Regulated Brokers
      • ASIC Regulated Brokers
      • FSCA Regulated Brokers
      • CFTC Regulated Brokers
    • Platform
      • MT4 Brokers
      • MT5 Forex Brokers
    • Strategies
      • Hedging Forex Brokers
      • Scalping Forex Brokers
      • Carry Trade Forex Brokers
      • Brokers for Indicators and EA’s
  • Start Here
    • Start Trading Guide
    • Beginner Trading Lessons
  • Free Forex Course
    • Public Login
    • Register
    • Password recovery
  • Lessons
    • Strategies
    • Videos
    • MT4 Guides
    • Money Management
  • Trade Setups
  • Tools
    • Correct Free Demo Charts
    • Forex Journal Download
    • Position Size Calculator
    • FULL List of Tools
    • Forex Demo Accounts
  • Price Action Guide
  • Free Course

SGDJPY Fires Off Engulfing Bar at Major Daily Resistance Area | 15th Oct 2015

Johnathon Fox
10/16/2015 | UPDATED ON: 08/06/2019

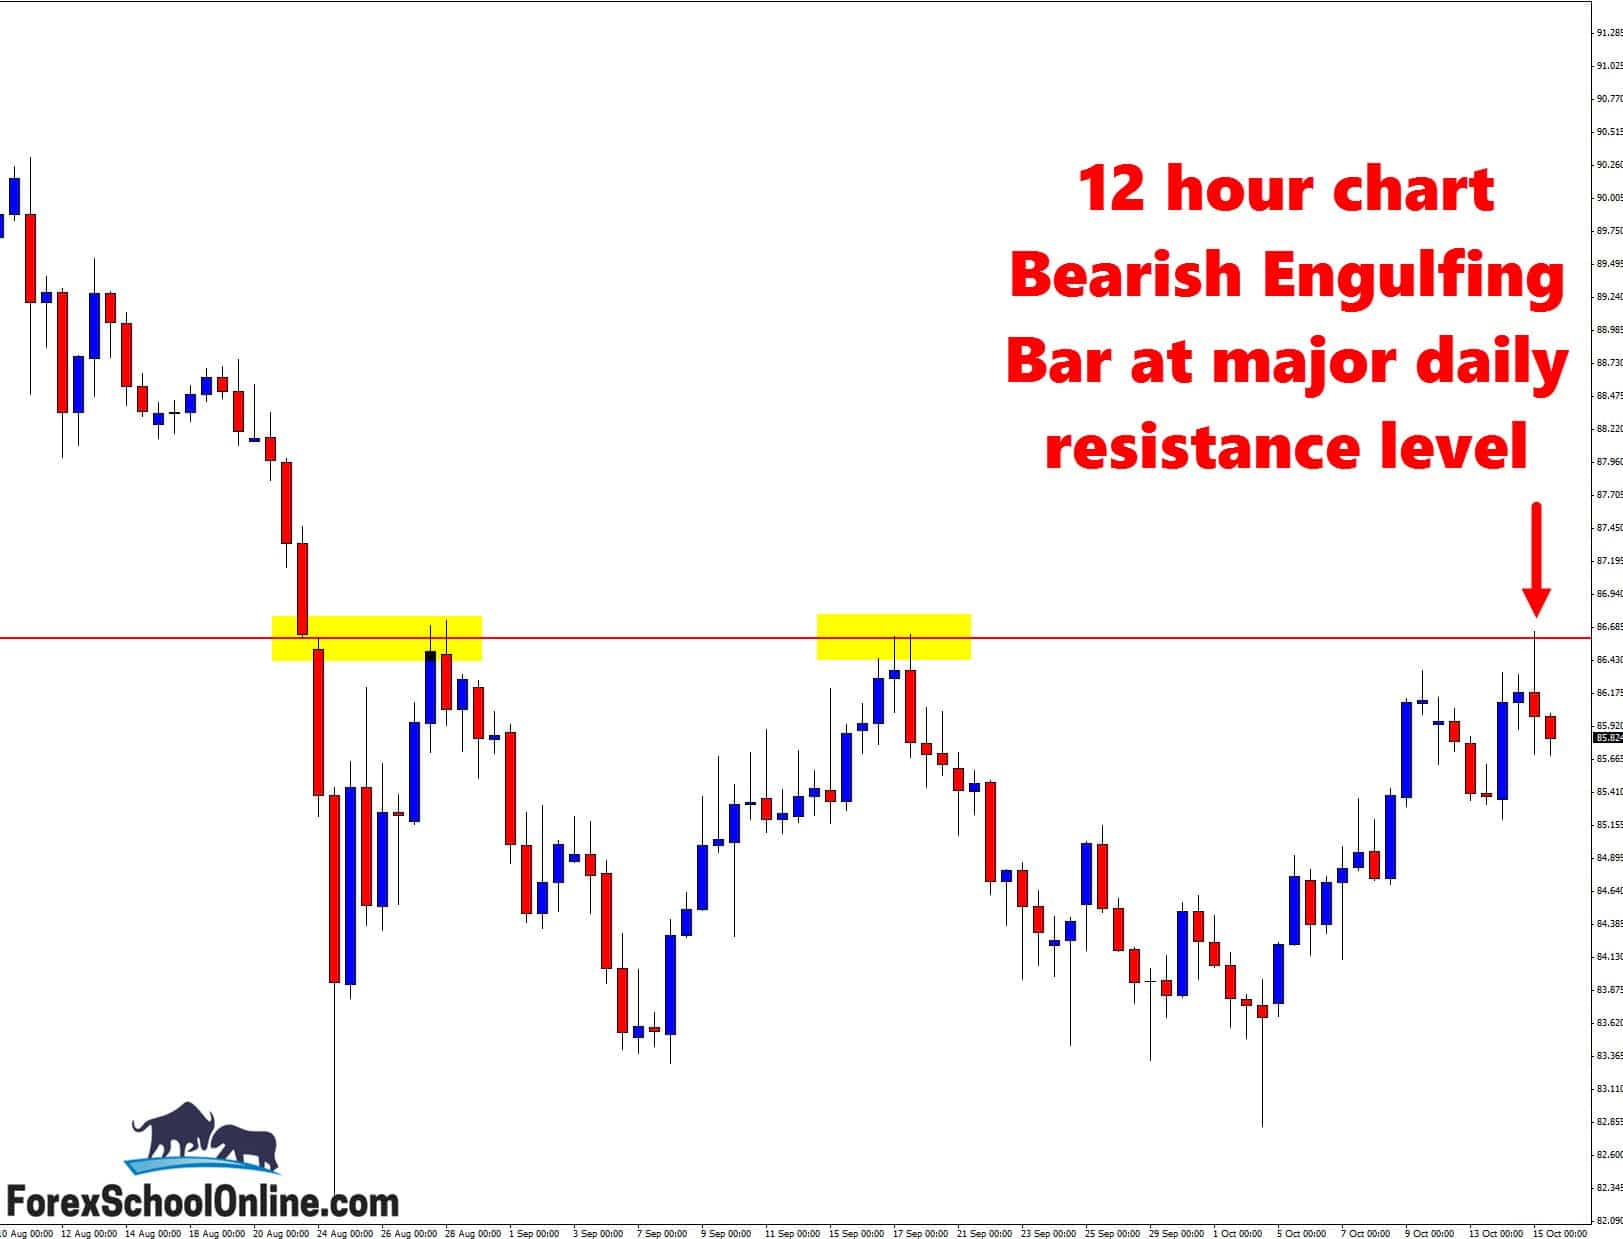
The SGDJPY has fired off a Bearish Engulfing Bar = BEEB at a major daily resistance level on the 12 hour price action chart. Whilst the trigger signal is always important for any trade that we assess, the level is an important one in this market.

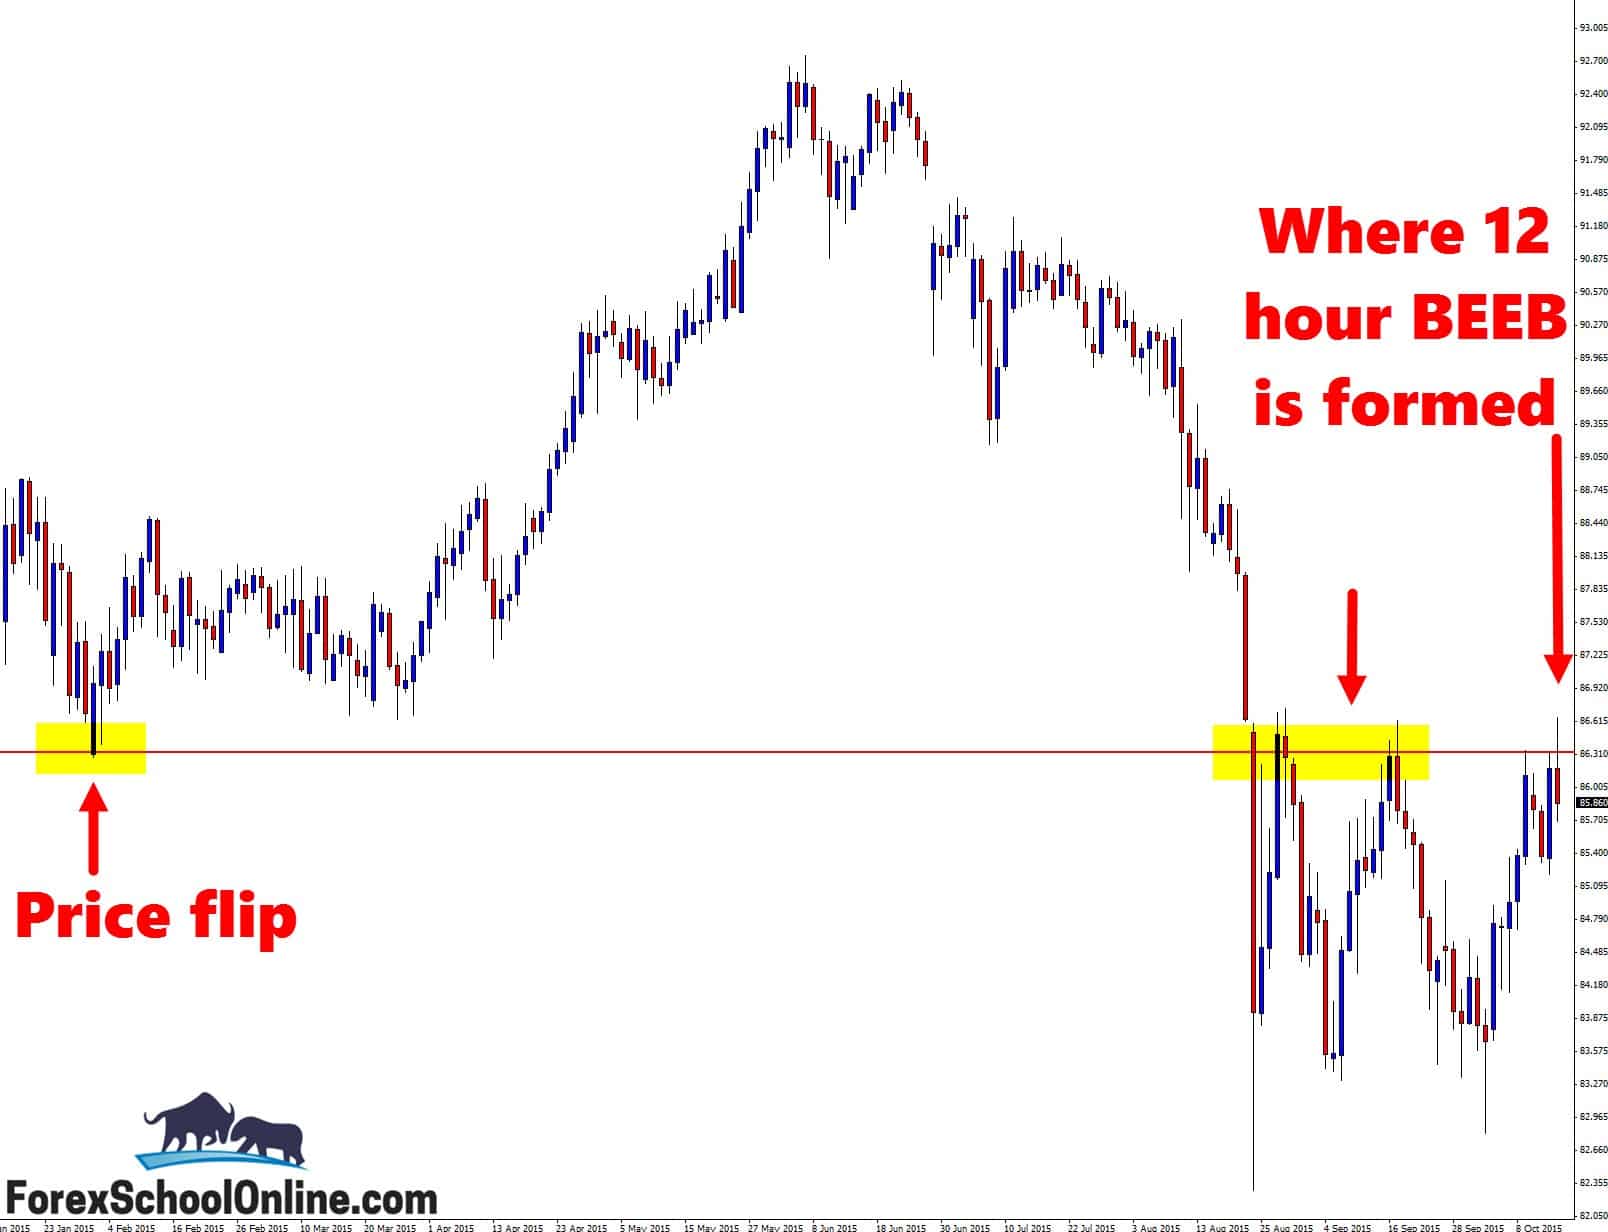
As you can see on my daily chart below, this level is a key level of importance and has acted as a price flip level, being a proven support and resistance level in the past. In only the last six weeks, price has made three major attempts at trying to break higher and through this daily resistance with all, until this point. being unsuccessful.

Price again, during yesterday/today’s sessions, moved higher and up into the daily resistance level to have another crack at breaking higher into freedom, but at this point, the bears are holding strong. It is at this level that price formed the bearish engulfing bar on the 12 hour chart.

I know a lot of you will be asking yourself “why the 12 hour chart?” The best two ways to explain this are 1: Giving you the link to my personal trading routine, which will show you how I go about my trading day, and will help you understand how this works. You can get that here: Johnathon Fox’s Forex Trading Routine, and 2: Explaining how I go through my charts.

When hunting for trade setups, the way I do it is not just willy-nilly looking for trade setups. It is with a system and method. I have my major levels marked on each chart. When price moves into one of these major levels that I am wanting to look for trades at, I will look for trigger signals.

I will start with the daily charts. I will look at the price action, then on the 4 hour charts. If there is nothing there to trade, but I could see the possibility that, if by blending a couple of candles together, I could make a trigger signal, then I would use the MT4 Change Time Frame Indicator to see what that new time frame looks like.

The MT4 change time frame indicator can make any time frame from a 2 minute chart to a 2 month chart, and if you want to use it, then you can grab it here: The MT4 Change Time Frame Indicator

The bearish engulfing bar on the 12 hour chart of the SGDJPY is not the strongest trigger signal. If we look at the engulfing bar by itself, in isolation without the price action around it, we will see that price closed up higher and not down lower like we would like it to.

What does this mean? If we are trading a BEARISH engulfing bar, we would like it to close as low, toward the bottom of the candles as possible, because that indicates that when the candle closed, the bears were still in control. If price closes back higher, then it shows that the bulls or buyers were taking back some control when the candle was closing. That’s why this setup is not as strong as we would like, even though the area is a solid one.


Daily Chart

SGDJPY

12 Hour Chart

12 hour time change indicator


Related Forex Trading Education

  • The MT4 Change Time Frame Indicator

Recommended Broker

  • Broker
  • Min Deposit
  • Benefits
  • Score
  • Visit Broker

$200

T&Cs Apply
  • The Lowest Trading Costs
  • 50% Welcome Bonus
  • Award-winning 24 Hour Support
5
Trade Now FreeBets Reviews
Reviews

About Johnathon Fox

Johnathon is a Forex and Futures trader with over ten years trading experience who also acts as a mentor and coach to thousands and has written for some of the biggest finance and trading sites in the world.

View all posts by Johnathon Fox →
Previous Post: « EURGBP Forms 4 hour Chart Bullish Engulfing Bar Breakout | 14th Oct 2015
Next Post: France 40 Fires Off 4 Hour Price Action Engulfing Bar Setup | 21 Oct 2015 »

Reader Interactions

Leave a Reply Cancel reply

Your email address will not be published. Required fields are marked *

Primary Sidebar

Forex School Online

High Probability Price Action Trading

How to make, manage and take profit from trades in the markets

Start Learning (It's Free!)

Turn Your Trades into Winners!

The Price action course is the in-depth advanced training on assessing, making and managing high probability price action trades.

Sign up for Free!

Recommended Broker

  • Broker
  • Min Deposit
  • Benefits
  • Score
  • Visit Broker

$200

T&Cs Apply
  • The Lowest Trading Costs
  • 50% Welcome Bonus
  • Award-winning 24 Hour Support
5
Trade Now FreeBets Reviews
Reviews

Footer

Get Our FREE Course, Bonus Strategies & Indicators!
X
Join Us Now!

Your capital is at risk.

X

CORNERSTONE LESSONS

Forex Trading for Beginners

Price Action Trading

How to Trade Forex

Technical Analysis

Forex Charts

Forex Trading Strategies

Money Management 

Compare Brokers

Best Forex Brokers

Forex Demo Accounts

Best Forex Trading Platforms

Forex Apps

Swap Fee Accounts

MT4 Brokers

CATEGORIES

Forex Videos

Trading Lessons

Weekly Trade Ideas

Start Here Guide

ForexSchoolOnline.com helps individual traders learn how to trade the Forex market

WARNING: The content on this site should not be considered investment advice and we are not authorised to provide investment advice. Nothing on this website is an endorsement or recommendation of a particular trading strategy or investment decision. The information on this website is general in nature so you must consider the information in light of your objectives, financial situation and needs.

Investing is speculative. When investing your capital is at risk. This site is not intended for use in jurisdictions in which the trading or investments described are prohibited and should only be used by such persons and in such ways as are legally permitted. Your investment may not qualify for investor protection in your country or state of residence, so please conduct your own due diligence or obtain advice where necessary. This website is free for you to use but we may receive a commission from the companies we feature on this site.

We Introduce people to the world of currency trading. and provide educational content to help them learn how to become profitable traders. we're also a community of traders that support each other on our daily trading journey

Forexschoolonline.com is not a financial advisor. Do your research before investing your funds in any financial asset or presented product or event. We are not responsible for your investing results.

Copyright © Forex School Online Sitemap  - Privacy Policy - Disclaimers & Terms of Use - CONTACT US