Tamadoge Price Prediction – August 5
As there has been a general slow-and-steady feature of lower lows over time in the bargaining worth of Tamadoge against the valuation of the US currency, the crypto market tends to explode despite the situation.
Ahead of anticipated forceful bounces, the crypto economy has continued to yield to variant reduction trade points. By the time the increase appears, sellers will be caught off guard. The market is currently moving through some of its lowest points ever, but there are deceptive signals that an early rebound is unlikely. Each possible buying entry order should therefore be viewed as an investment from a long-term perspective.
TAMA/USD Market
Key Levels
Resistance levels: $0.01000, $0.01100, $0.01200
Support levels: $0.00900, $0.00800, $0.00700
TAMA/USD Medium-term Chart
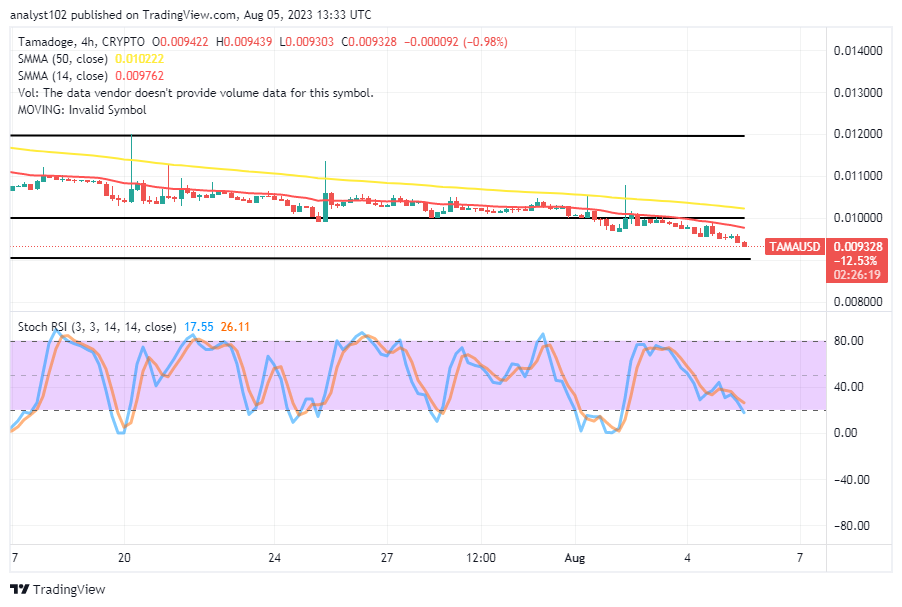
The TAMA/USD medium-term chart reveals that the crypto-economic market heads down and tends to explode any moment it is able to push above the trend lines of the Moving Averages.
The trend has predominated just below the sell signal side of the indicators, just below a series of smaller candlesticks with selling moments. The fact that the 14-day SMA trend line is below the 50-day SMA trend line supports this position even more. The stochastic oscillators are now moving south from 26.11 to 17.55 after crossing back to the downside from about 80. This indicates that there may be a level of downward correction taking place.
When will the current depreciation mode in the TAMA/USD market operations come to an end?
The moment that either a full body of bullish candlesticks or a long bottom shadow trading candlestick emerges in the TAMA/USD market operation, given that the crypto trade heads down, tends to explode in no time.
Investors should try to continue buying the dips no matter how long the cryptocurrency economy’s prolonged decline process lasts. Sellers in the market trading on MT4 platforms or similar platforms run the risk of suffering significant losses, especially if they neglect to plan their entrance in conjunction with the force that the US coin has been sustaining against TAMA.
TAMA/USD Short-term chart
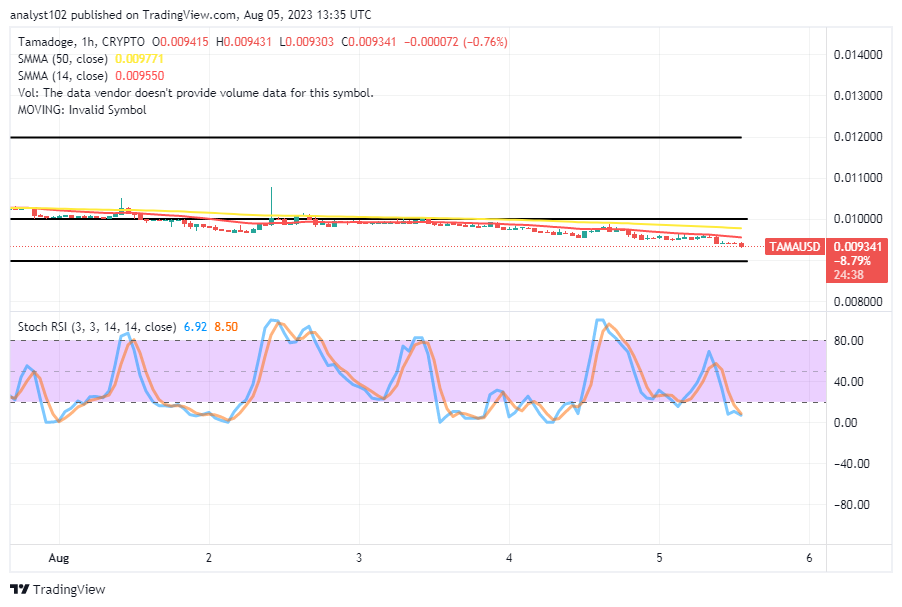
The TAMA/USD short-term chart showcases that the crypto-economic market heads down and tends to explode, as it is even shifting in retardation against bulls at the moment.
As the 50-day SMA indicator is near the top of the smaller selling candlesticks’ speed path, the 14-day SMA indicator has remained closely positioned above it. The Stochastic Oscillators have changed their positions into the oversold area, maintaining the rate of decline between 8.50 and 6.92. Buyers must stick to the trade-spot technique described below while making purchases.
It will soon be time for 48 hours of nonstop Tamadoge play.
It’s almost time for 48 hours of uninterrupted Tamadoge gameplay 😎
— TAMADOGE (@Tamadogecoin) August 4, 2023
Happy weekend, Tama Army! pic.twitter.com/3ARDTMMcWN
Do you want a coin that would 100X in the next few months? That is Tamadoge. Buy TAMA today
Note: Forexschoolonline.com is not a financial advisor. Do your research before investing your funds in any financial asset or presented product or event. We are not responsible for your investing results.


Leave a Reply