Tamadoge Price Prediction – December 1
The bargain stances between bulls and bears as regards the operations of Tamacoin against the trade worth of the American currency have been tentatively put under the settings of a low-pace driving force, given that the crypto-economic market currently re-energizes, building momentum signal.
Even though it is possible for events to occur from the present trading level of $0.0016239, it is unlikely that they will hold in the long run due to the oscillating tools’ technical outlook being in an oversold state for a while. It is possible that the price has decreased to a level that is attractive for resuming a lengthy order as of the time this study was written.
Resistance levels: $0.0025, $0.0035, $0.0045
Support levels: $0.00075, $0.0005, $0.00025
TAMA/USD Medium-term Chart
The medium-term TAMA/USD chart depicts that the crypto-economic market currently re-energizes, building momentum inputs.
The way the Bollinger Bands’ trend lines have been extending indicates a tendency toward northward repositioning. Candlesticks that have been developing at the time of writing have barely made it to the bottom end of the indicators, which is an indication that a good buy entry is about to occur. In order to indicate that sellers may soon run out of energy, the stochastic oscillators have systemically increased their presence in the oversold area.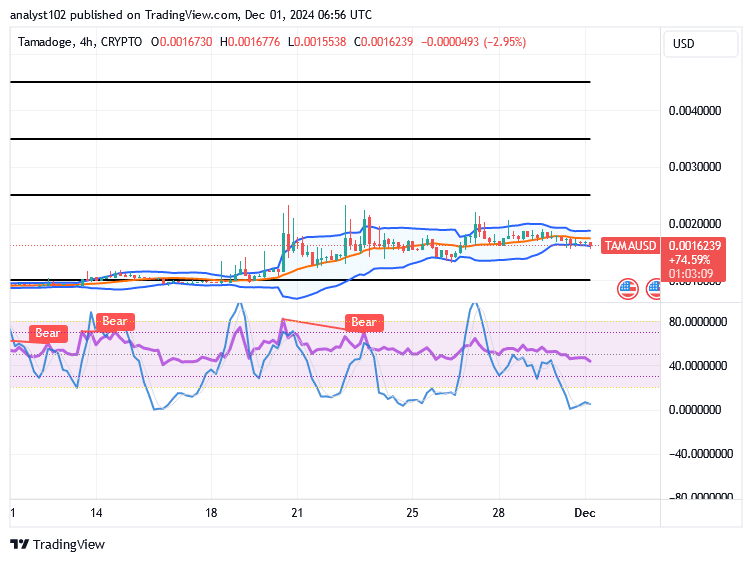
Will the market for TAMA/USD consolidate positions on the lower Bollinger Band threshold?
Expectation to see the TAMA/USD market bears consolidating on the basis of the lower Bollinger Bands might cause a little further in the featuring of minute lower lows to cause a delay in seeing back up rising velocity in the emerging crypto economy, given that the price presently re-energizes, building momentum signs.
The stochastic oscillators’ logical viewpoints indicate that another wave of dip-buying orders is imminent. Additionally, it indicates that whenever the timing is right to counteract the advances to the negation route, a rebound will undoubtedly appear quickly.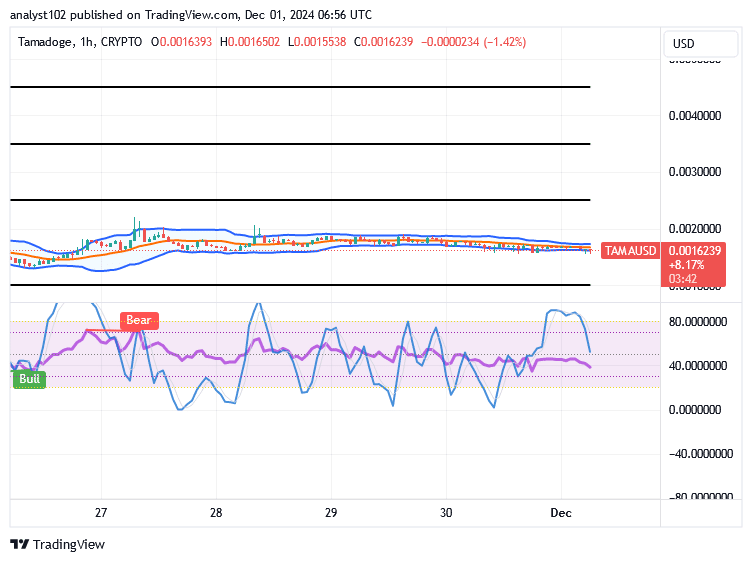
The TAMA/USD short-term
The TAMA/USD short-term chart showcases that the crypto-economic market re-energizes, building momentum signals.
The Bollinger Bands’ trend lines have been continually extending eastward since the indicators’ hourly establishment. There have also been lower highs and lower lows with variant candlesticks. Around 40, the stochastic oscillators are positioned in a southbound-turning posture. Buyers will quickly start to secure eager orders because of its potency.
Sundays are not the time to unwind in the #Tamaverse!
Get a Puppy #NFT for free when you register! Utilize your 20 bonus credits to get up the scoreboard more quickly.
Sunday isn’t for resting in the #Tamaverse! 🚀
— TAMADOGE (@Tamadogecoin) August 18, 2024
How’s your high score looking? 🤔
Keep up to date as you go. ✅
Get exclusive $TAMA rewards on #Tamadogi 🏆
👉 Get a free Puppy #NFT when you sign up! Use your 20 free credits fast track you up the leaderboard 🤑 pic.twitter.com/EIUVREGYwN
Do you want a coin that would 100X in the next few months? That is Tamadoge. Buy TAMA today
Note: Forexschoolonline.com is a financial advisor. Do your research before investing your funds in any financial asset or presented product or event. We are not responsible for your investing results.

Leave a Reply