Weekly Price Action Trade Ideas – 20 Nov 2018
Markets Discussed Today: BITCOIN, CADCHF, GOLD v USD and AUS200.
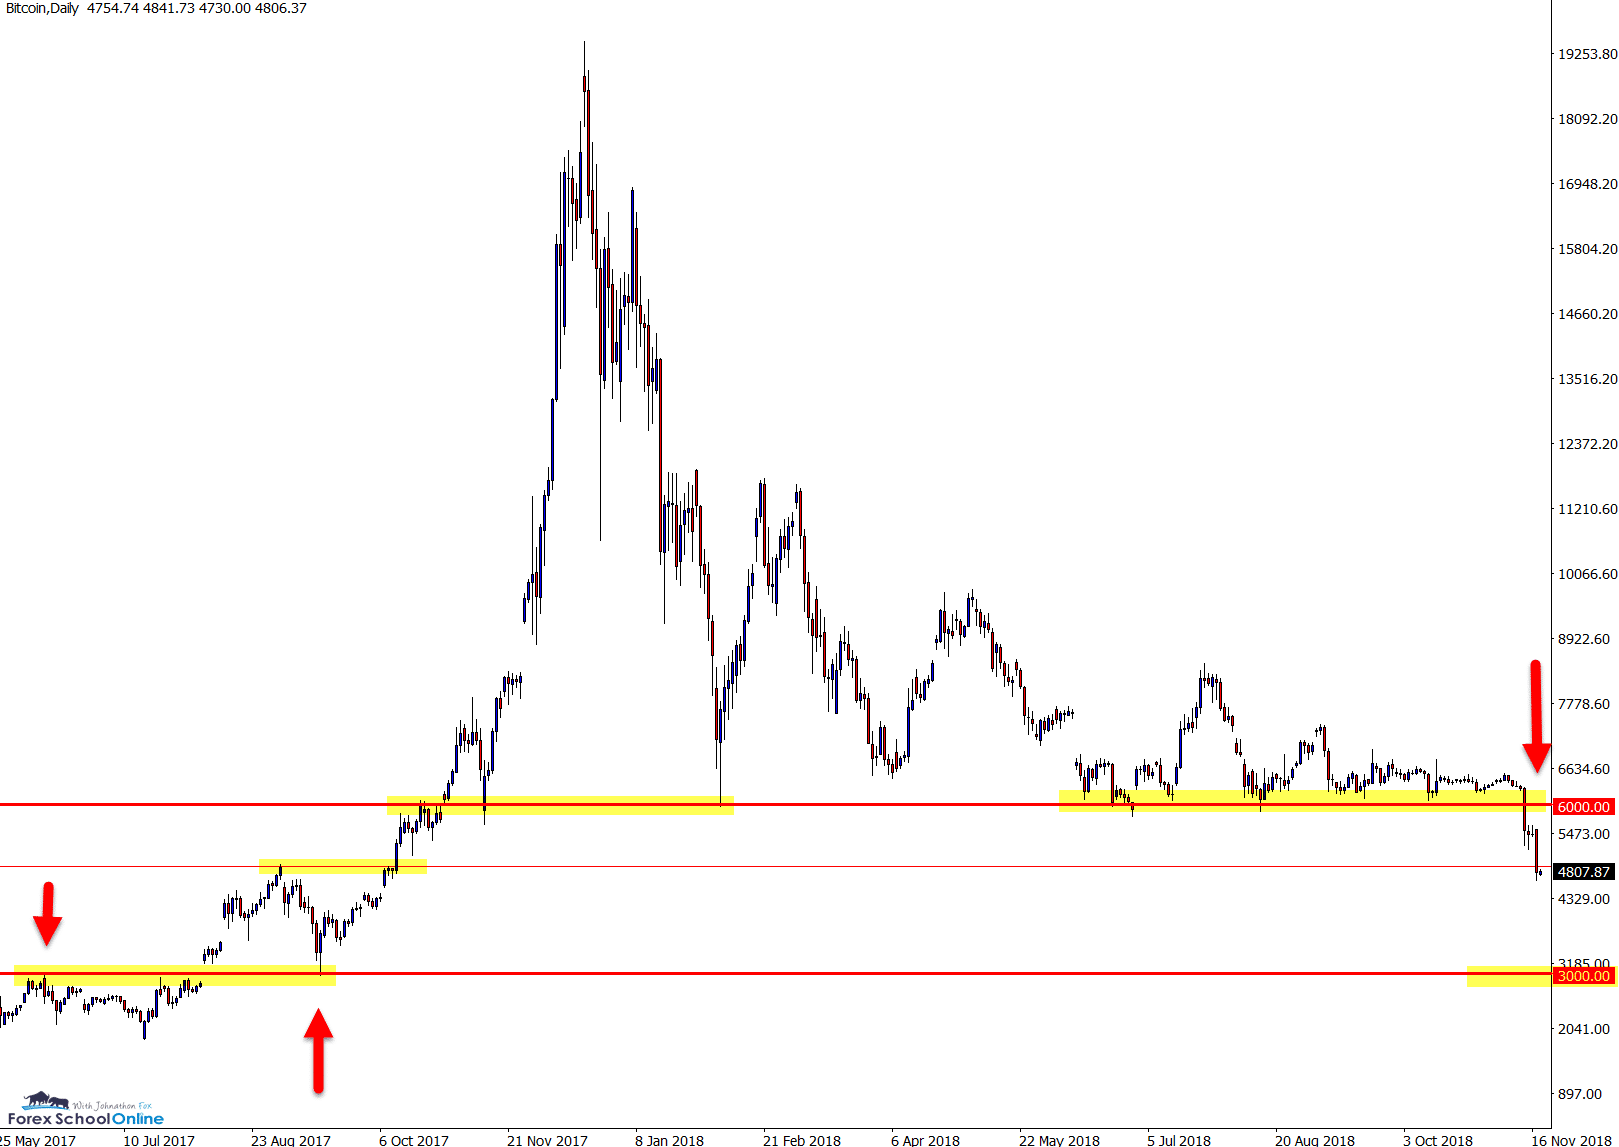
BITCOIN Daily Chart
Price Breaks Very Big Round Number
The Very Big Round Number = VBRN in the Bitcoin market we have been watching and looking to break has finally been smashed, with price crashing lower.
As we discussed in the recent weekly price action summary, price in this market had drawn to a standstill and was winding up tighter and tighter just sitting above this crucial level.
This level had been incredibly important in this market for some time and now price is below it we can see the next support is already being tested.
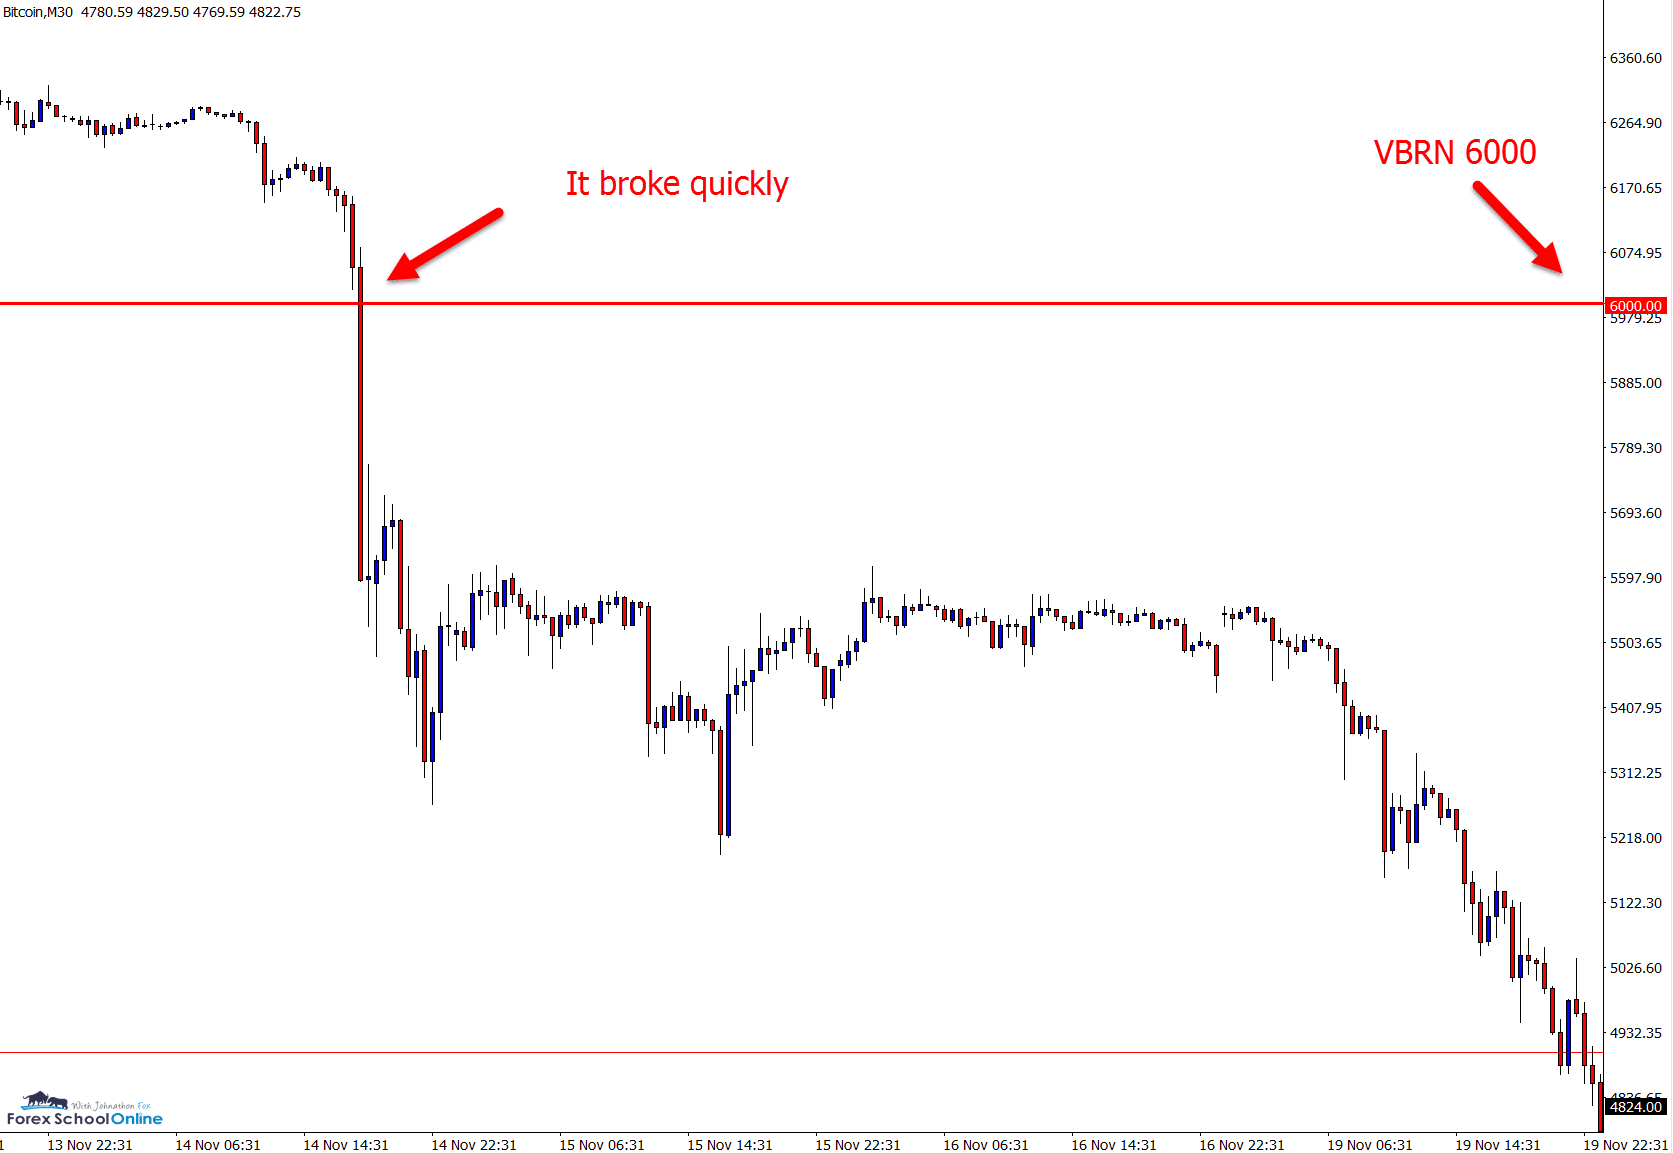
We often find this is the case. The longer price holds and tests a level, the more extreme and aggressive the breakout will be when it does unfold.
This is because no one wants to partake of a market that is not moving, but there are a whole ton of orders set for when the market does breakout.
This acts like wildfire. Traders are entered when the market does break, and on the flip side; the traders hoping price does not break because they are in trades are stopped out as they have their stops activated.
As the charts show below; if price can continue to move lower, the next major level comes in around the VBRN 3000.
Daily Chart
30 Minute Chart
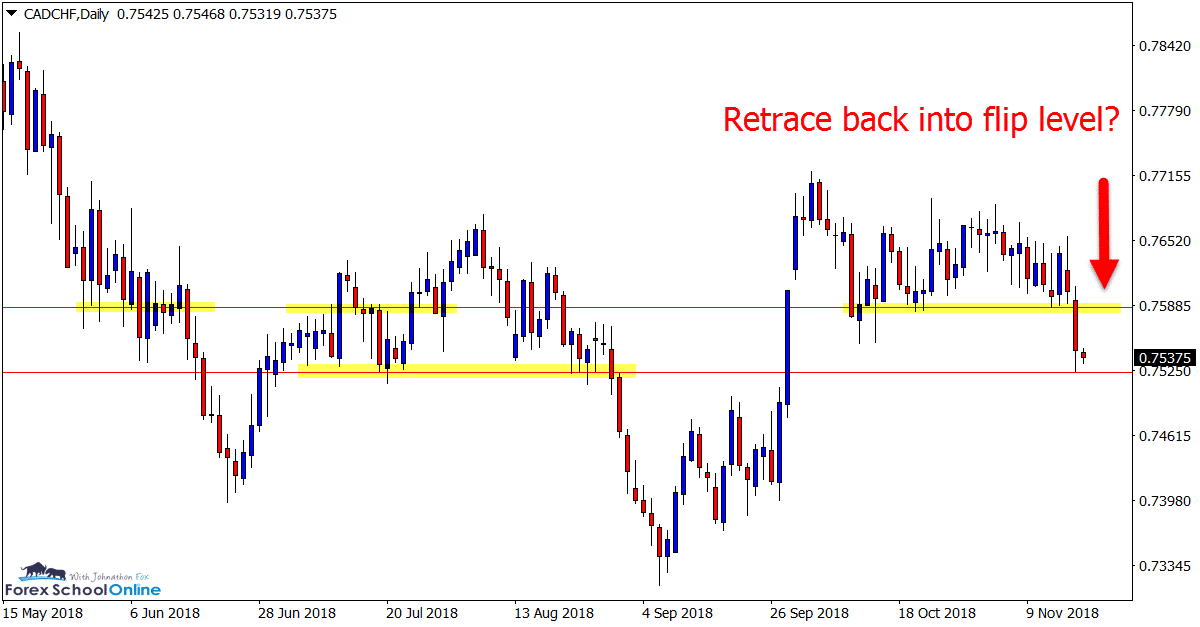
CADCHF Daily Chart
Price Smashes Through Support
Price on the CADCHF has smashed through its key support level after being stuck inside a ranging box.
Price has broken and moved directly into the near-term support level.
This market has no clear trend and has been choppy in recent times. A retrace higher back into the support and potential new resistance could provide an opportunity to look for bearish triggers.
Daily Chart
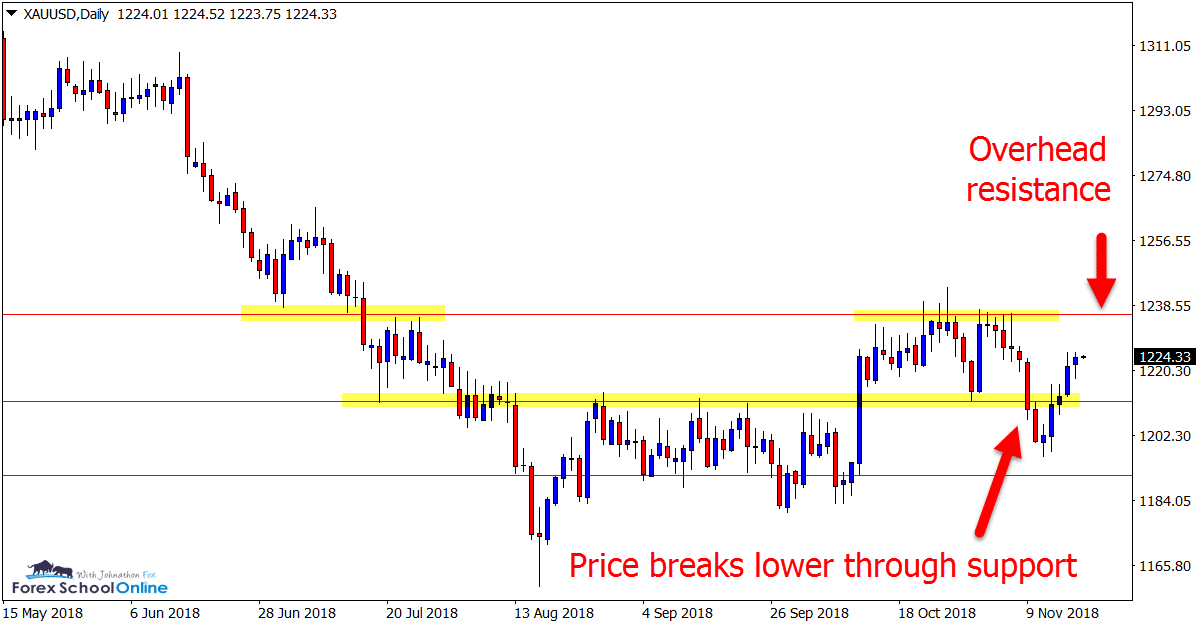
GOLD Daily and 1 Hour Charts
Overhead Resistance Within Reach
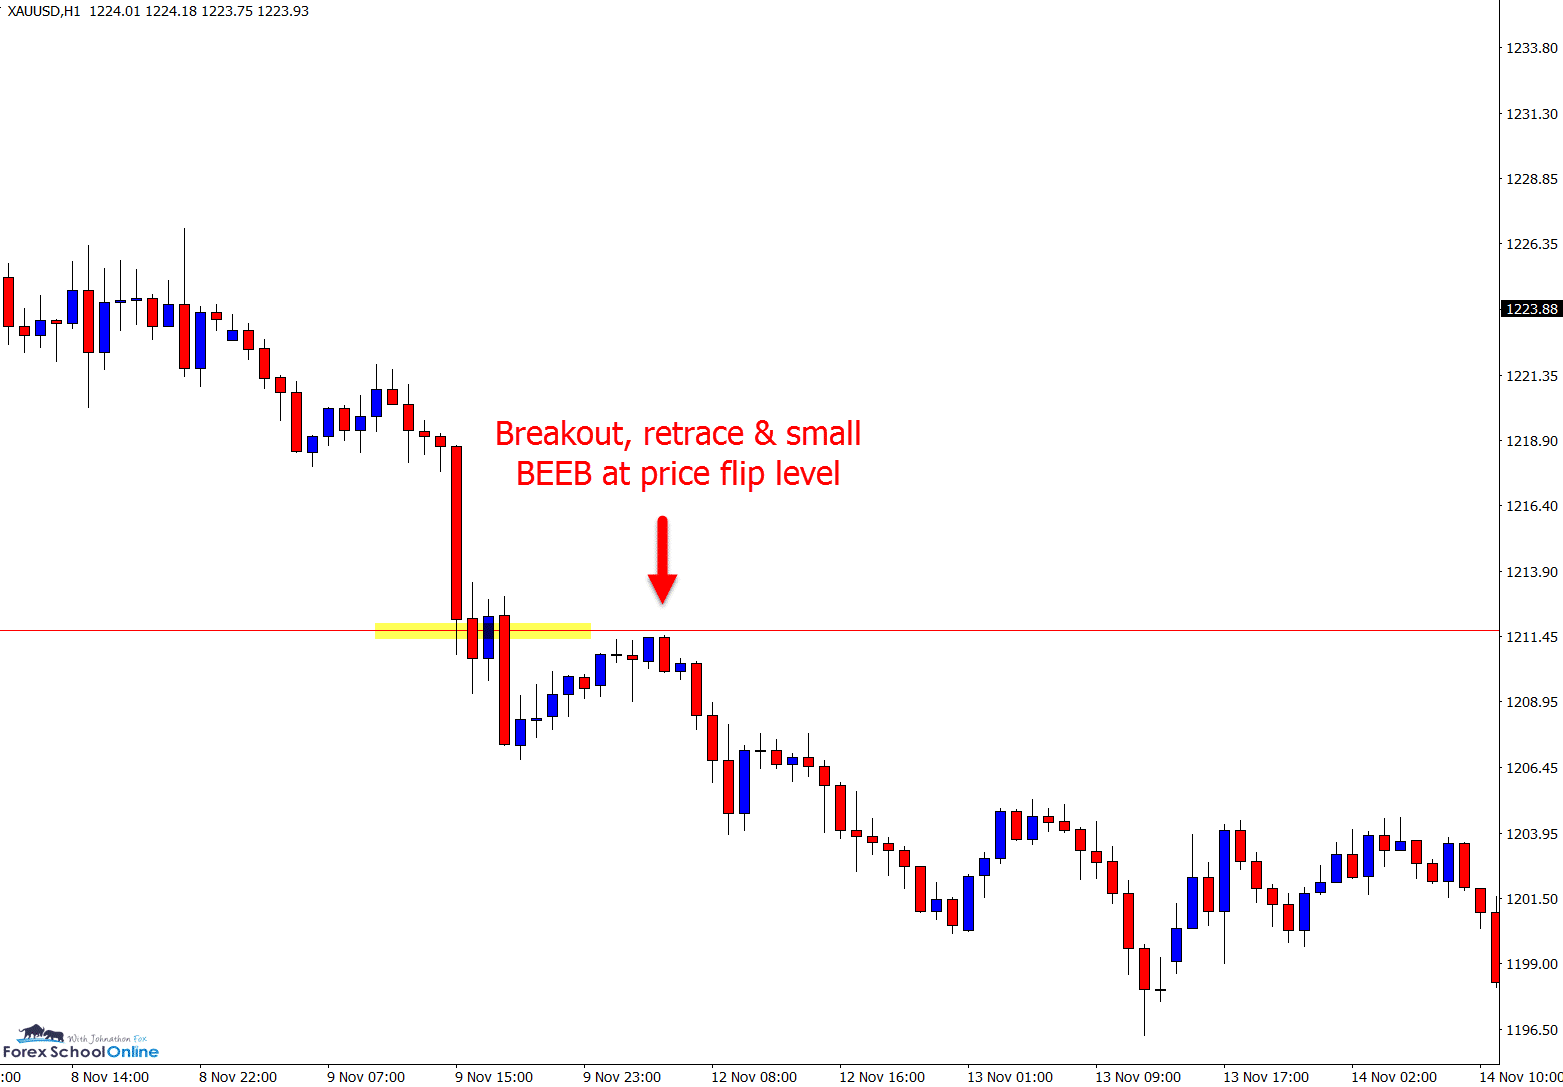
After breaking the price flip support level we highlighted as crucial in our previous charts in focus, price retraced and re-tested it on intraday charts as a new resistance.
For aggressive traders trading on intraday charts like the 1 hour time frame, price broke the support level and rotated back into the same daily price flip level.
As the 1 hour chart shows below; price formed a small Bearish Engulfing Bar before moving lower.
On the daily chart we can see that this midway range point has been flip flopping with price breaking above, below and now back above.
Price is working off a base low and if it can move into the resistance and even break it, then it could gain some momentum higher.
Daily Chart
1 Hour Chart
AUS200 Daily Chart
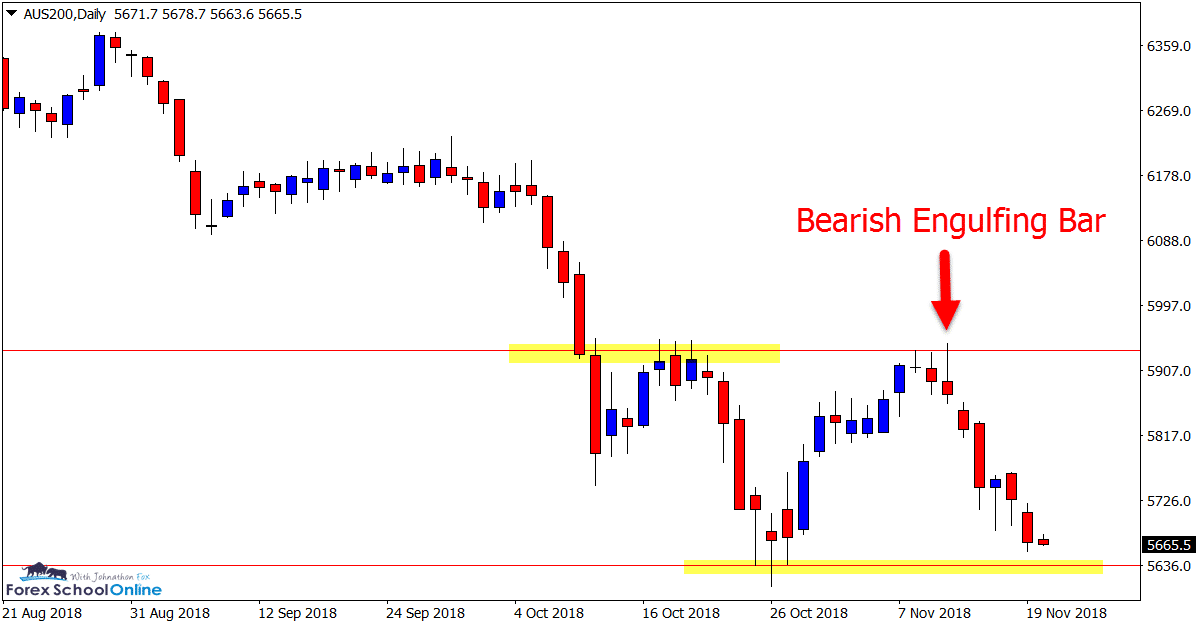
Bearish Engulfing Bar Sends Price Lower
Price formed a solid daily chart Bearish Engulfing Bar at the major resistance level in this market after making a nice swing higher.
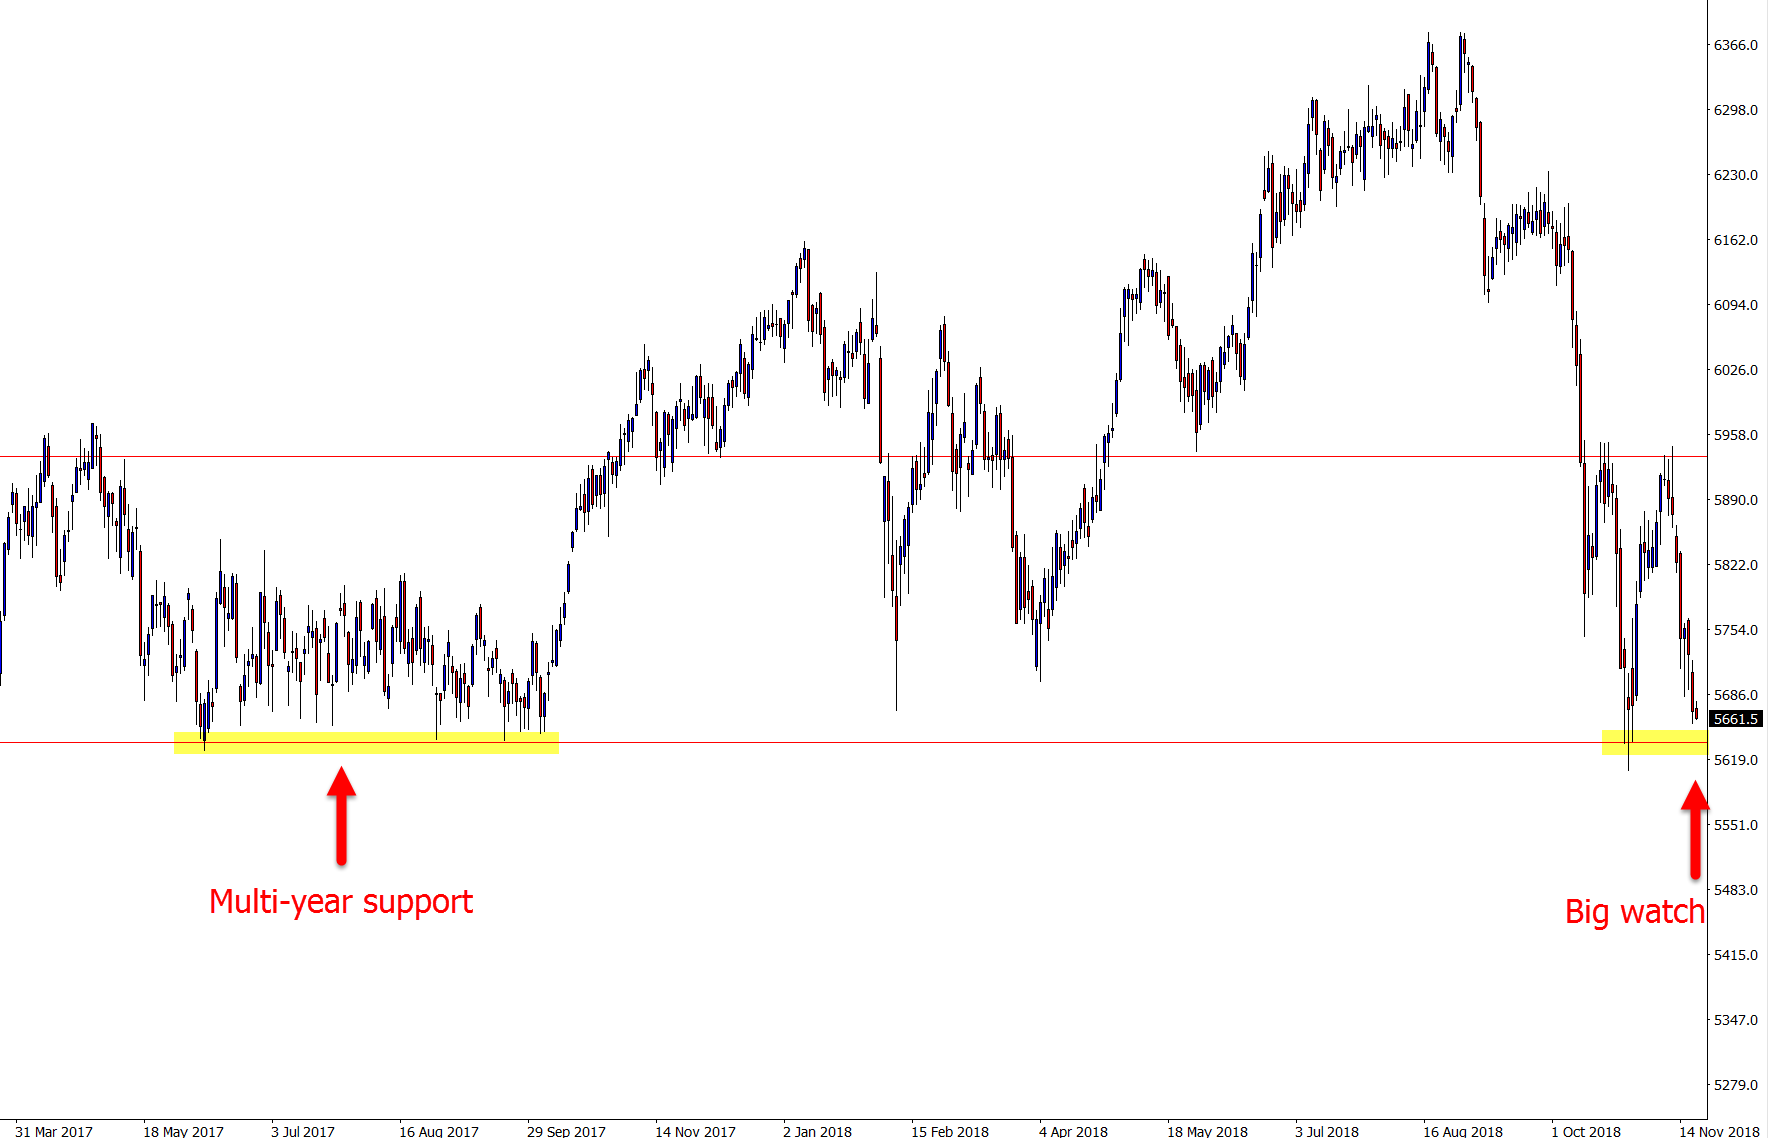
After rejecting resistance with the reversal setup, price has collapsed and is now looking to test the multi-year support level that looks to be crucial for this market and where price goes next.
As the zoomed out chart shows; this level has been tested on many occasions in the past few years with price holding each time.
This level is a huge watch over the coming sessions.
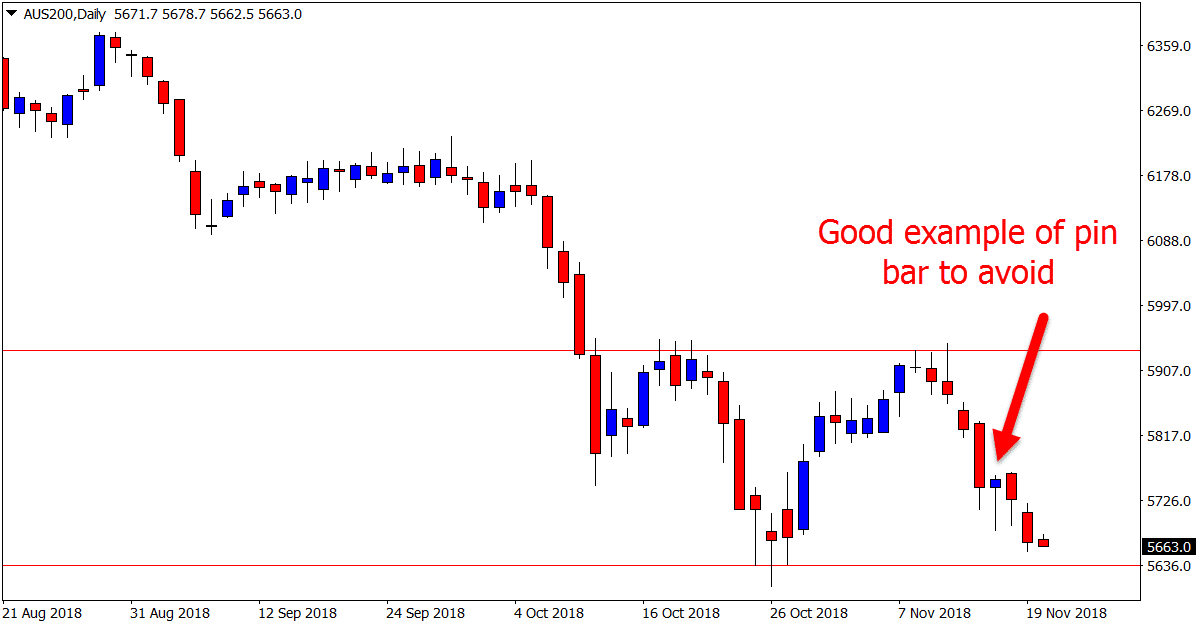
I have highlighted a pin bar that often sucks traders into getting into trades. These pin bars form at extreme highs or lows after huge moves, but are unremarkable and do not have much to back them up. They are often small, not at key levels and are where traders are exiting after they have just made a large profit.
Daily Chart
Daily Chart
Daily Chart
Note: We Use Correct ‘New York Close 5 Day Charts’ – Download Free New York Close Demo Charts Here
Charts in Focus Note: All views, discussions and posts in the ‘charts in focus’ are the view of Forex School Online and are not recommendations or trading advice. All posts are general in nature and are not advice to buy or sell.
Please leave questions or comments in the comments section below;

Thanks for the Analysis Mr. Fox. Keep on the good work. That’ll be a good help for newbie like me. Can you please add more trade ideas on major currency pair like EURUSD & USDJPY?
Hi Barnar,
nice to have you.
You can find all previous summaries and discussions here; https://www.forexschoolonline.com//weekly-price-action-setups-forecast-commentary/
We discuss the pairs / markets making moves and setting up for the week. If a major pair is not doing much and something else is, then we will include it instead.
Safe trading,
Johnathon