The AUD/USD price action recently tested the level of 0.7000. However, price action lacks the steam to move significantly above this mark, consequently, it retraced downwards from this mark. Let’s examine this new upside move attempt and see how it will fare.
Major Price Levels:
Top Levels: 0.6984, 0.7000, 0.7030
Floor Levels: 0.6944, 0.6900, 0.6880

AUD/USD Price Continues the New Session Above the 9-Day Moving Average
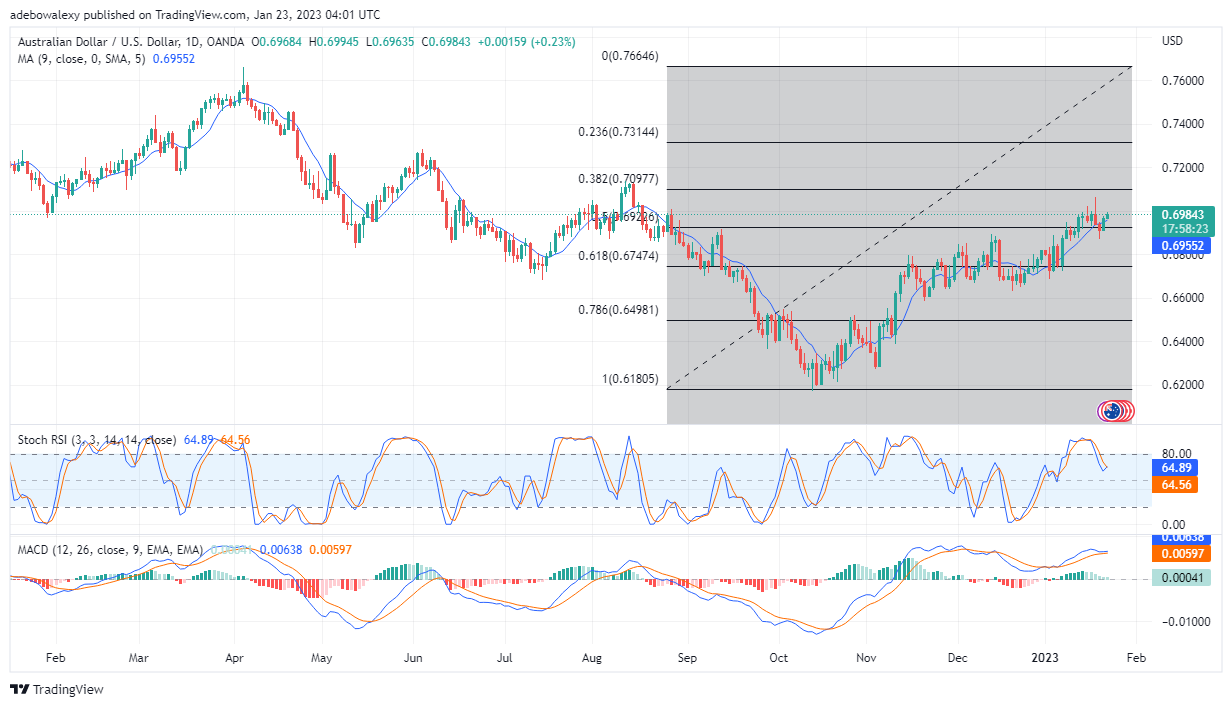
On the AUD/USD daily market, price action broke the 9-day MA to the upside last Friday. Furthermore, trading activities for the new week have started with the pair making gains above the MA line. A green price candle has appeared for the ongoing session above the 9-day MA line. Also, the MACD indicator seems to have aborted its bearish crossover move, and its lines could be seen to have resumed their upside path. Meanwhile, the Stochastic RSI indicator has delivered a bullish crossover at 64.89 and 64.56 marks. By implication, technical indicators are predicting that price action will most likely move further upward.

AUD/USD Technical Indicator Stays Positive Despite Minor Downward Retracement
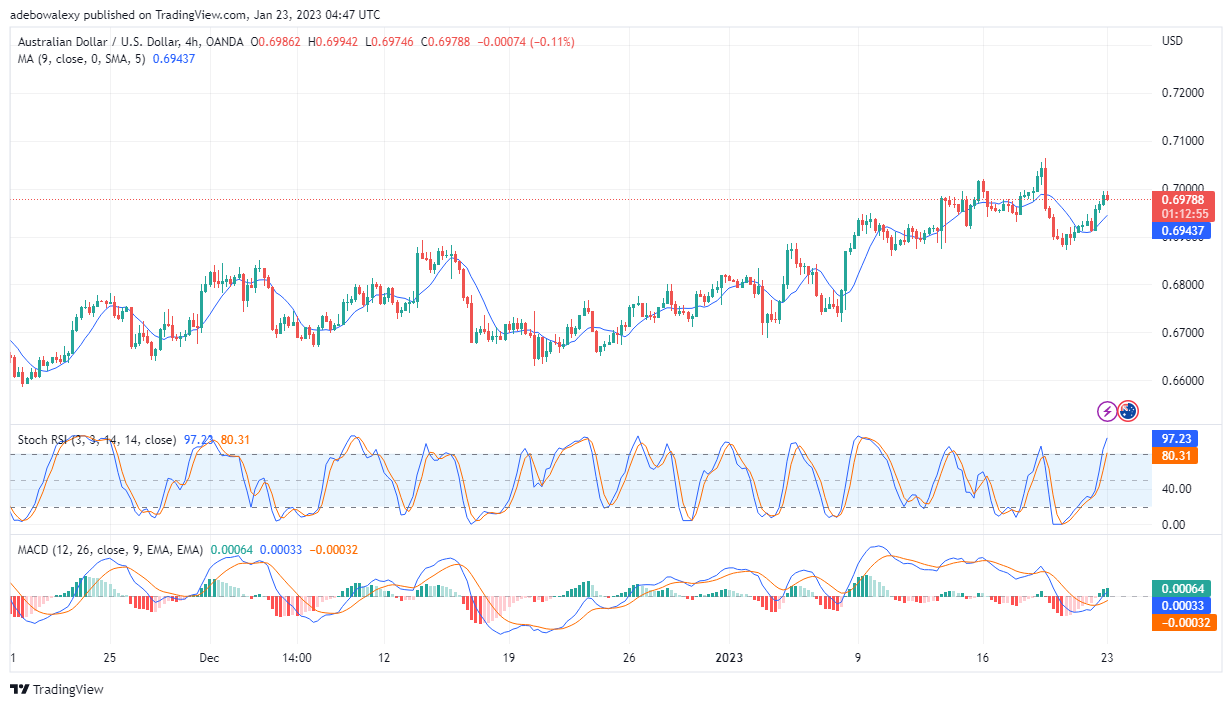
In the 4-hour market, a new session has begun with a minor downward retracement in price. This could be observed as AUD/USD prices declined from 0.6984 to 0.6979. Nevertheless, technical indicators are still hinting that prices are still on their way up. Price action is still very much above the MA line, which is telling that the price may still resume its upward path. Also, the histogram bars of the MACD indicator are still pointing to an increase in momentum, as these bars now have a solid green appearance. Additionally, the RSI lines are still rising into the overbought region. These lines are now at the 97 and 80 marks. Consequently, the AUD/USD price seems to remain on track toward revisiting the 0.7000 mark.
Do you want to take your trading to the next level? Join the best platform for that here.


Leave a Reply