• Skip to primary navigation
  • Skip to main content
  • Skip to primary sidebar
  • Skip to footer

ForexSchoolOnline.com

Learn to Trade Forex Online

  • Compare Brokers
    • Broker Type
      • Paypal Brokers
      • Swap-Free Brokers
      • Low Spread Brokers
      • ECN / STP Brokers
      • Market Maker Brokers
      • Non Dealing Desk Brokers
      • Low Minimum Deposit Brokers
    • Country
      • Brokers for Australia
      • Brokers for South Africa
      • Brokers for the UK
      • Brokers for the US
      • Brokers for Nigeria
    • Regulation
      • FCA Regulated Brokers
      • ASIC Regulated Brokers
      • FSCA Regulated Brokers
      • CFTC Regulated Brokers
    • Platform
      • MT4 Brokers
      • MT5 Forex Brokers
    • Strategies
      • Hedging Forex Brokers
      • Scalping Forex Brokers
      • Carry Trade Forex Brokers
      • Brokers for Indicators and EA’s
  • Start Here
    • Start Trading Guide
    • Beginner Trading Lessons
  • Free Forex Course
    • Public Login
    • Register
    • Password recovery
  • Lessons
    • Strategies
    • Videos
    • MT4 Guides
    • Money Management
  • Trade Setups
  • Tools
    • Correct Free Demo Charts
    • Forex Journal Download
    • Position Size Calculator
    • FULL List of Tools
    • Forex Demo Accounts
  • Price Action Guide
  • Free Course

Weekly Price Action Charts in Focus – Aug 27th 2018

Johnathon Fox
08/27/2018 | UPDATED ON: 08/05/2019

Weekly Price Action Charts in Focus – Aug 27th 2018

Note: We Use Correct ‘New York Close 5 Day Charts’ – Download Free New York Close Charts Here
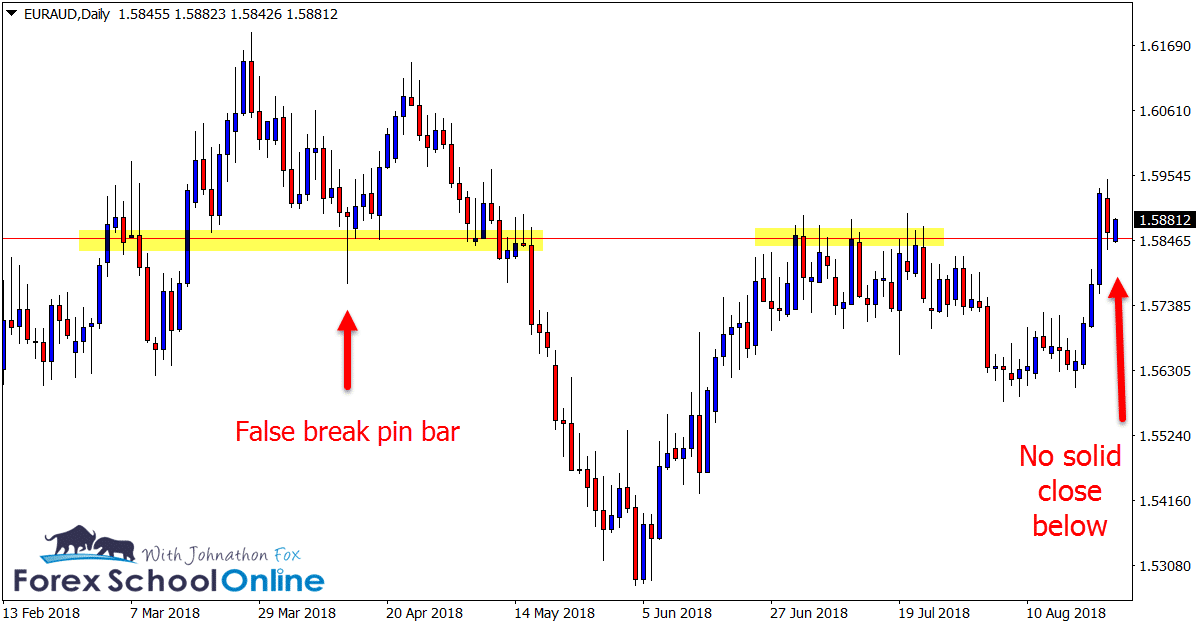
EURAUD DAILY CHART 

Price Fails to Close Above Major Support

Price action on the EURAUD daily chart has recently smashed higher and through a major resistance level.

At the time of writing, price is making a major test of the old resistance and new support price flip level after not being able to close below it.

Watching to see if price has either closed above or below a major level can give us a huge clue to where and what price is looking to do.

In this case we can see price has made an attempt to break back lower and through the old resistance and new support price flip, but it is continuing to hold as a new support and price flip.

This works the same way for individual candles and the strength they close with. For example; how strong or weak an engulfing bar closes tells us a lot about the strength of the candle / trigger.

euraud daily chart


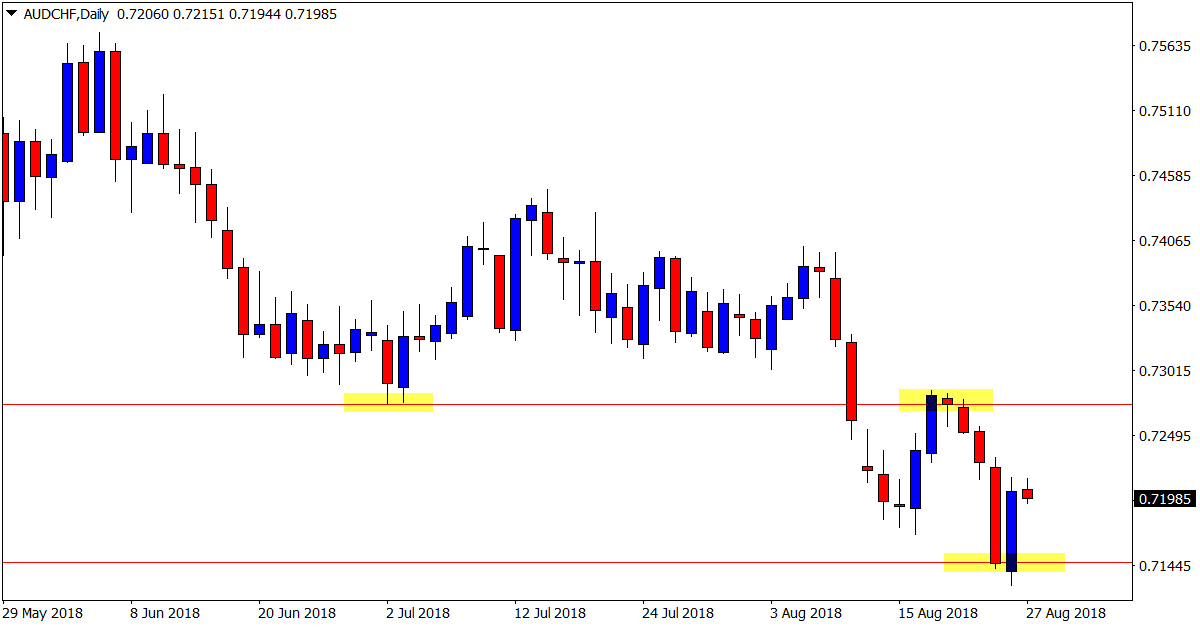
AUDCHF DAILY & 4 HOUR CHARTS

Major Test and BUEB

Whilst all the momentum had been lower in recent times on the AUDCHF, we can see that price has run into a major support level.

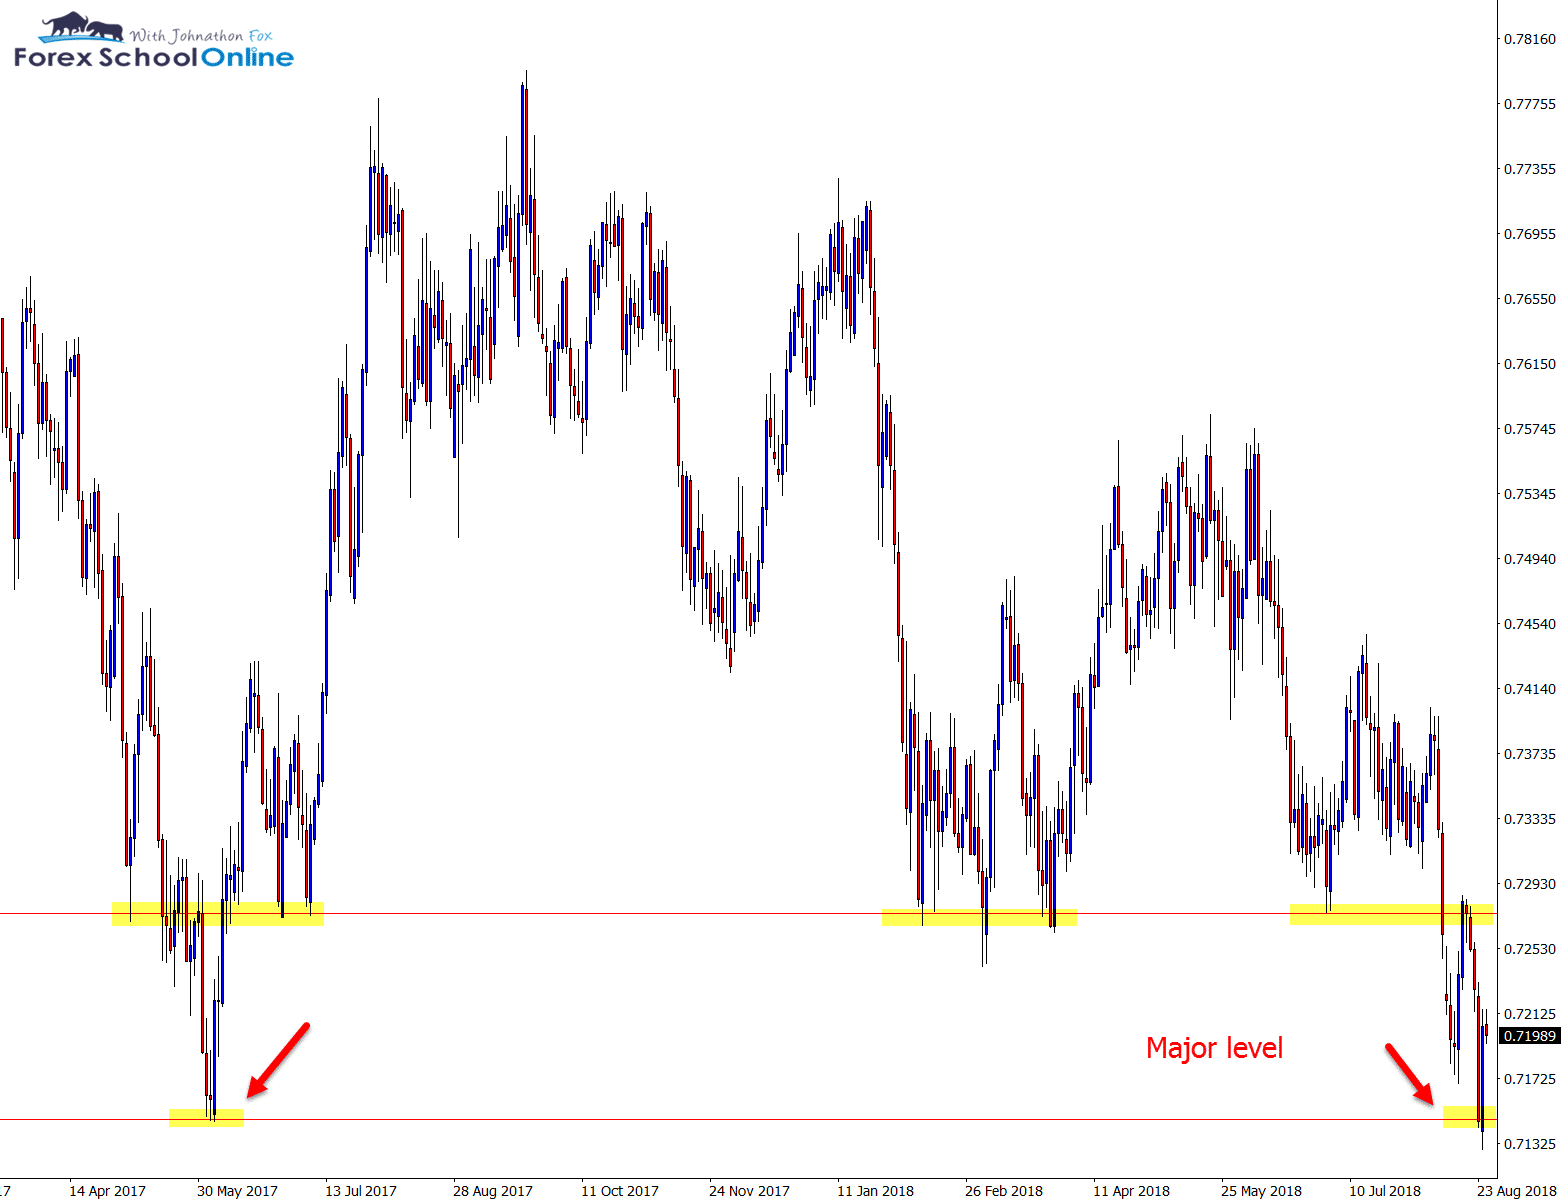
As shown on the zoomed out daily chart below; this level was a proven previous support and price was making a re-test. One of the trickiest parts for traders is knowing when to make trades with the trend, in a range and against the trend.

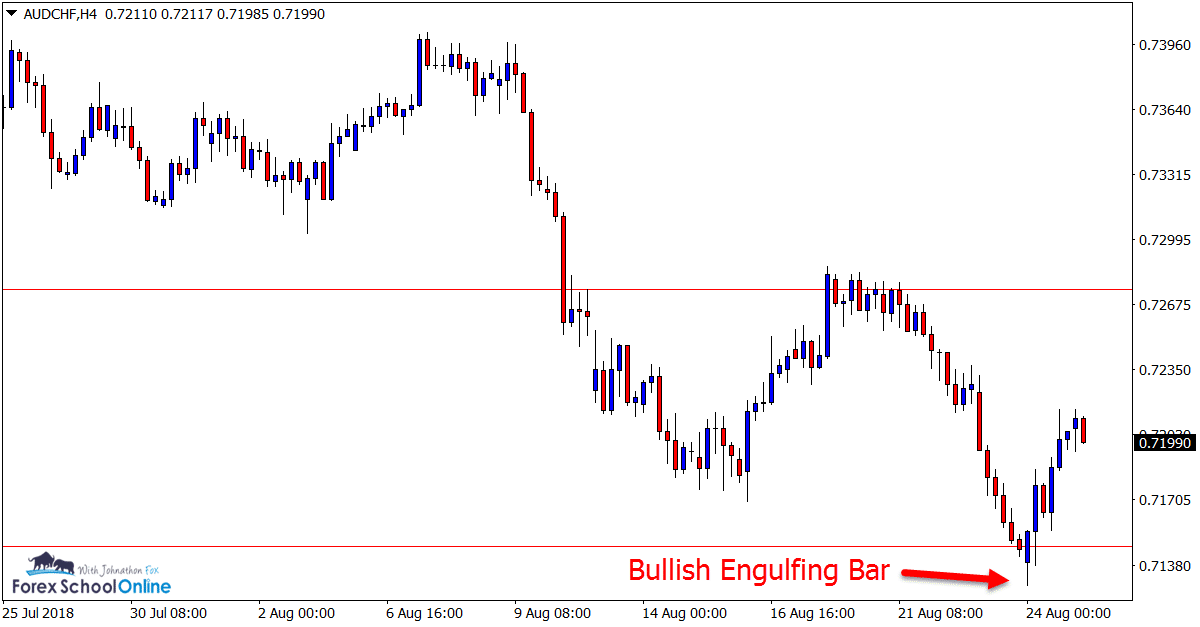
When making trades against a strong move or momentum we always need to see a lot of ticks in the box and a lot of confirmation. In other words; trades against the trend need to have a lot in their favor to make them worth the risk, including the potential reward.

The 4 hour chart shows a clear Bullish Engulfing Bar = BUEB rejecting the major daily chart level that had a lot of space to move back higher into.
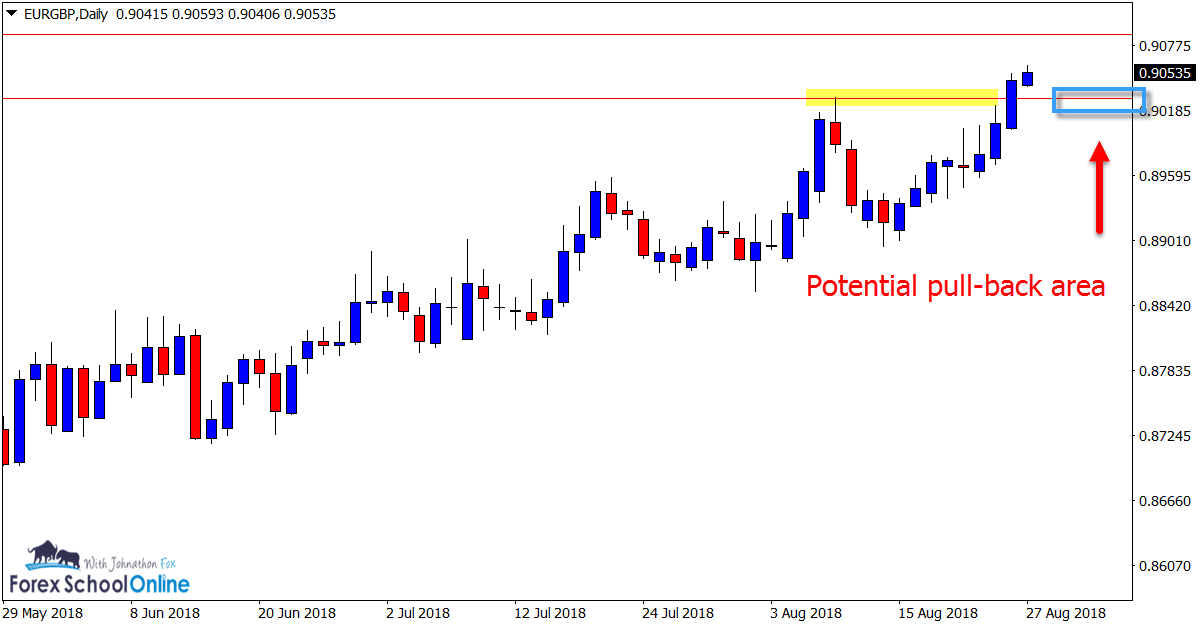
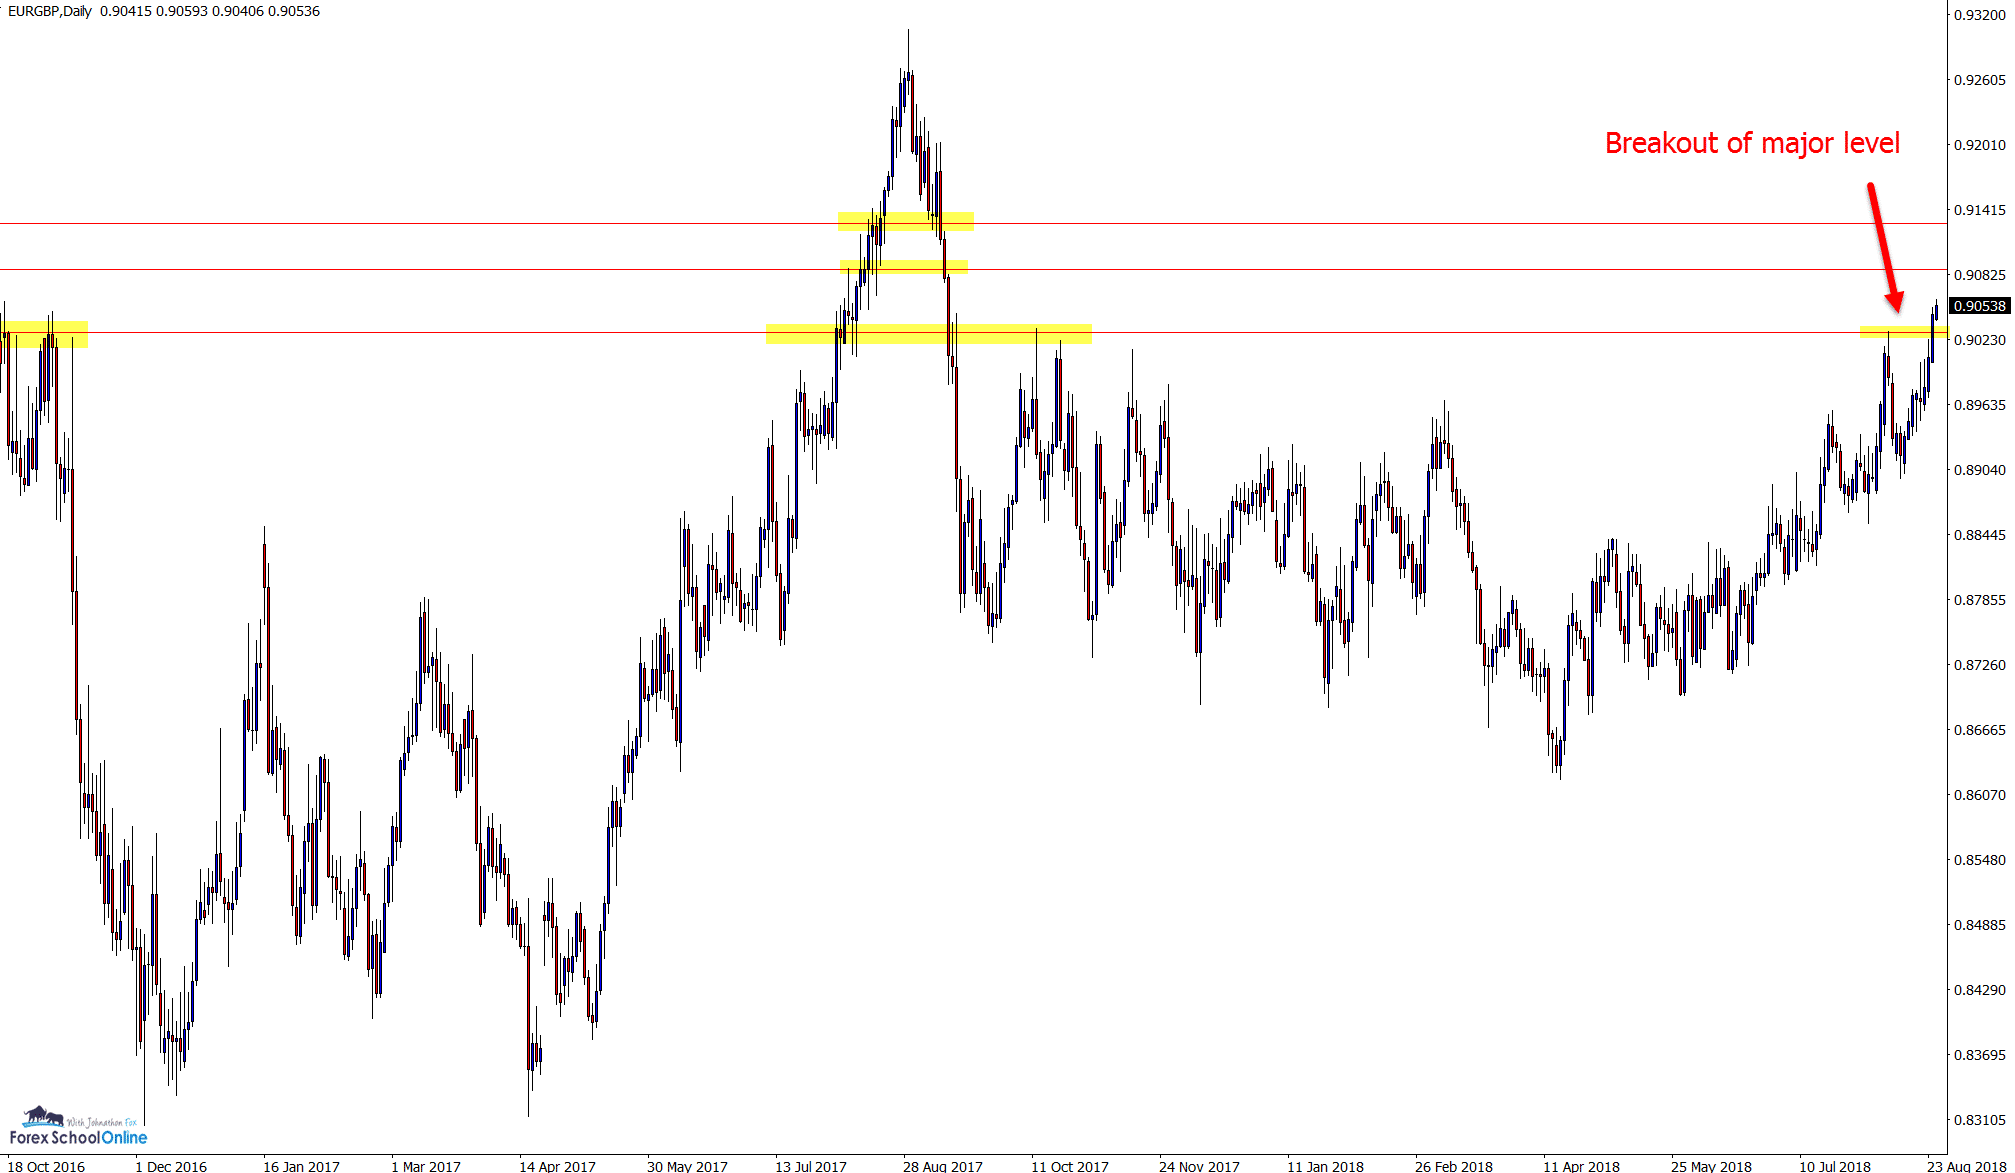
AUDCHF Daily chart


AUDCHF 4 hour chart


EURGBP DAILY CHART

Strong Trend Higher With Potential Retrace

Price on the EURGBP daily chart has been making consistent higher highs and higher lows in a clear price action trend higher.

Continuing on this trend, price broke the recent swing high and resistance level and moved further higher.

This daily level could present as an area to look for price to rotate back into and a level for price to potentially hold as old resistance and new support. Smaller time frames such as the 4 hour or 1 hour charts could tip traders off as to whether this level is holding and looking to fire of a bullish reversals signal.

EURGBP Daily Chart


eurgbp daily price action


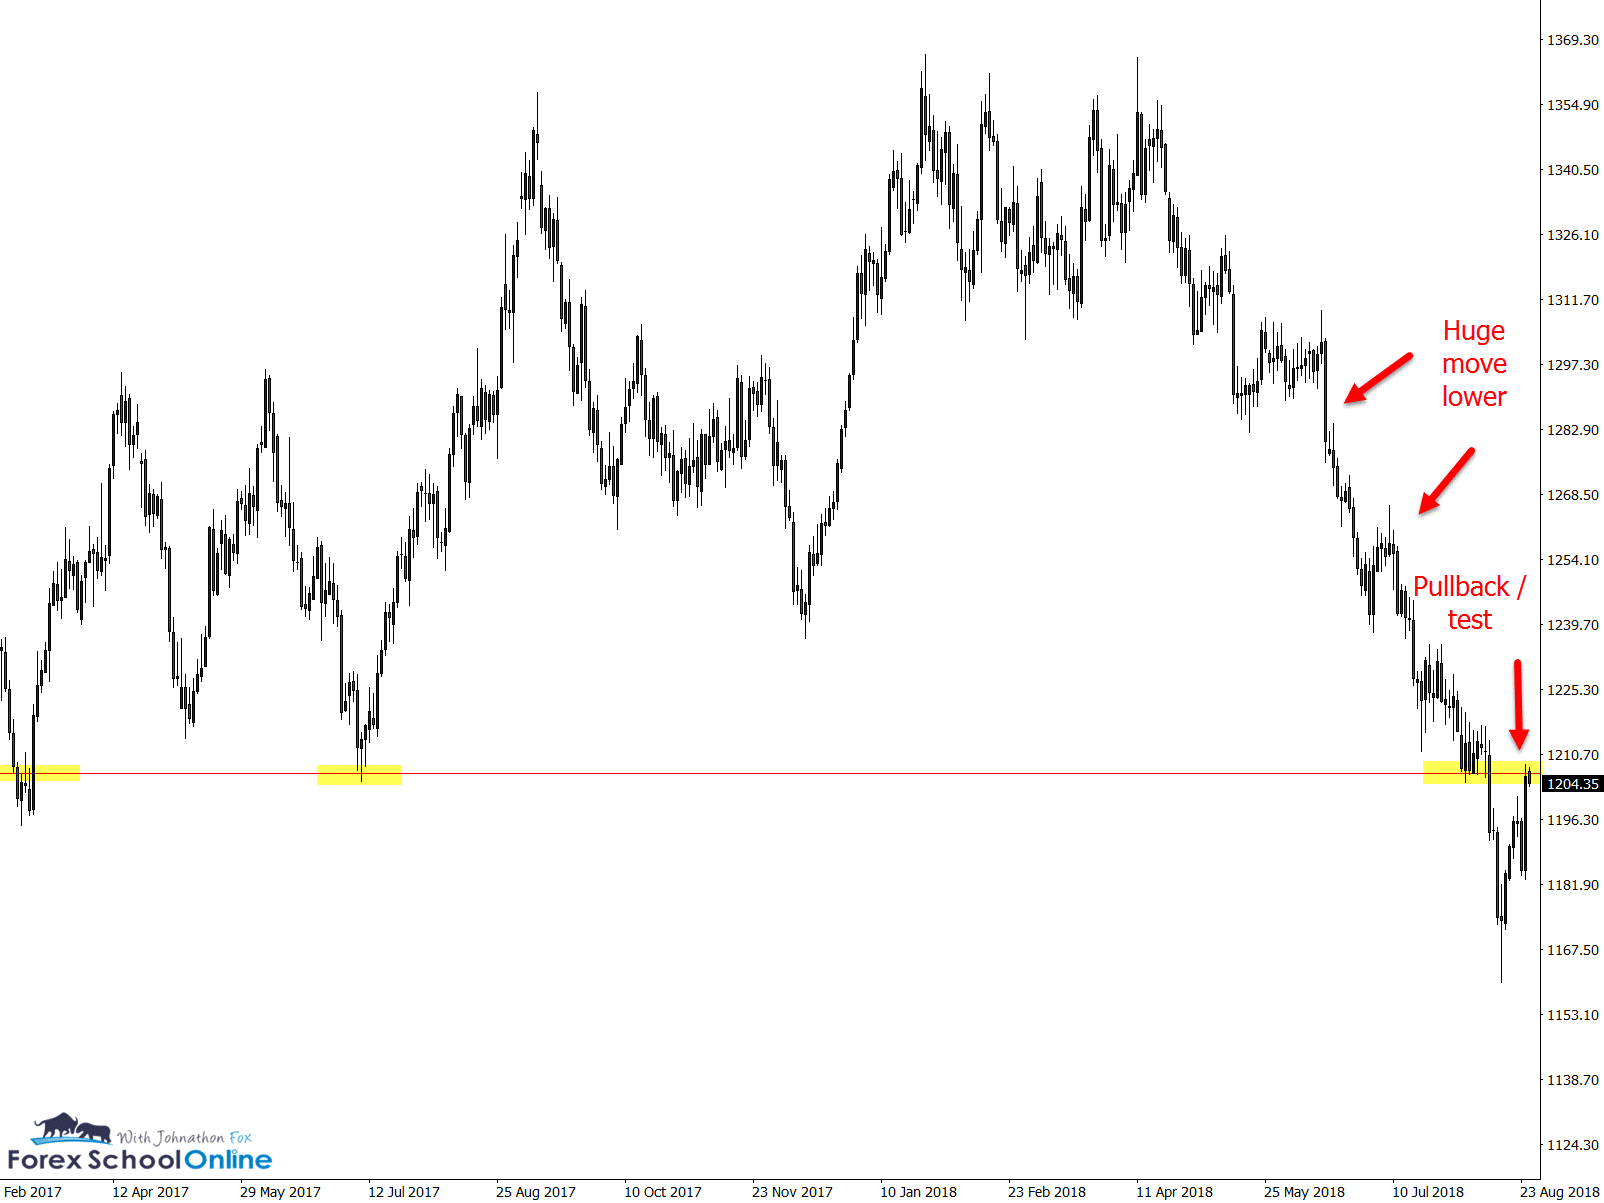
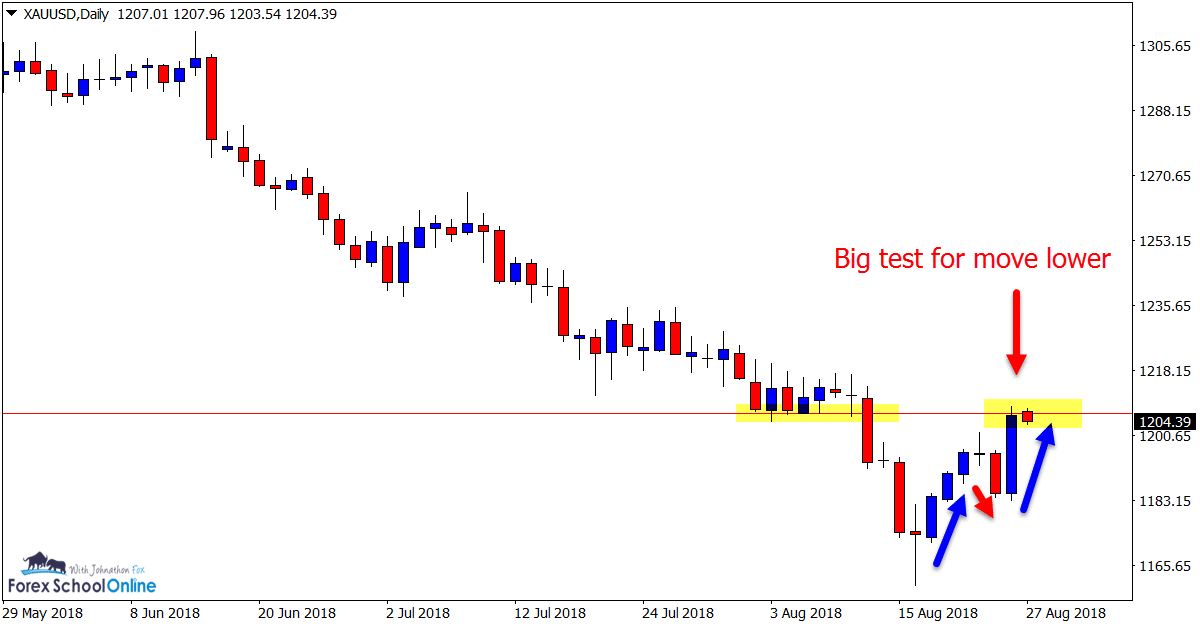
GOLD v USD DAILY CHART

Huge Move Lower With Price Rotating Back Higher

In recent times price on the Gold v USD chart has been smashed lower with rotations back higher into value only to sell back lower.

Price has now made another rotation back higher and into the overhead resistance level.

This is an interesting test to watch over the coming sessions as price has not just rotated back straight higher, but formed a mini base pattern showing the bulls / buyers are trying to attempt a resurgence.

This level could prove critical.

gold daily chart


Gold Daily Chart


Charts in Focus Note: All views, discussions and posts in the ‘charts in focus' are the view of Forex School Online and are not recommendations or trading advice. All posts are general in nature and are not advice to buy or sell.


Recommended Broker

  • Broker
  • Min Deposit
  • Benefits
  • Score
  • Visit Broker

$200

T&Cs Apply
  • The Lowest Trading Costs
  • 50% Welcome Bonus
  • Award-winning 24 Hour Support
5
Trade Now FreeBets Reviews
Reviews

About Johnathon Fox

Johnathon is a Forex and Futures trader with over ten years trading experience who also acts as a mentor and coach to thousands and has written for some of the biggest finance and trading sites in the world.

View all posts by Johnathon Fox →
Previous Post: « Support and Resistance: The Ultimate Guide to Price Action Charts
Next Post: Charts in Focus Weekly Trade Ideas Summary – 4th Sep »

Reader Interactions

Leave a Reply Cancel reply

Your email address will not be published. Required fields are marked *

Primary Sidebar

Forex School Online

High Probability Price Action Trading

How to make, manage and take profit from trades in the markets

Start Learning (It's Free!)

Turn Your Trades into Winners!

The Price action course is the in-depth advanced training on assessing, making and managing high probability price action trades.

Sign up for Free!

Recommended Broker

  • Broker
  • Min Deposit
  • Benefits
  • Score
  • Visit Broker

$200

T&Cs Apply
  • The Lowest Trading Costs
  • 50% Welcome Bonus
  • Award-winning 24 Hour Support
5
Trade Now FreeBets Reviews
Reviews

Footer

Get Our FREE Course, Bonus Strategies & Indicators!
X
Join Us Now!

Your capital is at risk.

X

CORNERSTONE LESSONS

Forex Trading for Beginners

Price Action Trading

How to Trade Forex

Technical Analysis

Forex Charts

Forex Trading Strategies

Money Management 

Compare Brokers

Best Forex Brokers

Forex Demo Accounts

Best Forex Trading Platforms

Forex Apps

Swap Fee Accounts

MT4 Brokers

CATEGORIES

Forex Videos

Trading Lessons

Weekly Trade Ideas

Start Here Guide

ForexSchoolOnline.com helps individual traders learn how to trade the Forex market

WARNING: The content on this site should not be considered investment advice and we are not authorised to provide investment advice. Nothing on this website is an endorsement or recommendation of a particular trading strategy or investment decision. The information on this website is general in nature so you must consider the information in light of your objectives, financial situation and needs.

Investing is speculative. When investing your capital is at risk. This site is not intended for use in jurisdictions in which the trading or investments described are prohibited and should only be used by such persons and in such ways as are legally permitted. Your investment may not qualify for investor protection in your country or state of residence, so please conduct your own due diligence or obtain advice where necessary. This website is free for you to use but we may receive a commission from the companies we feature on this site.

We Introduce people to the world of currency trading. and provide educational content to help them learn how to become profitable traders. we're also a community of traders that support each other on our daily trading journey

Forexschoolonline.com is not a financial advisor. Do your research before investing your funds in any financial asset or presented product or event. We are not responsible for your investing results.

Finixio Ltd, Tower 42, 25 Old Broad Street, London EC2N 1HN | [email protected]

Copyright © Forex School Online - Finixio Ltd Company no. 11705811 - Sitemap  - Privacy Policy - Disclaimers & Terms of Use - CONTACT US