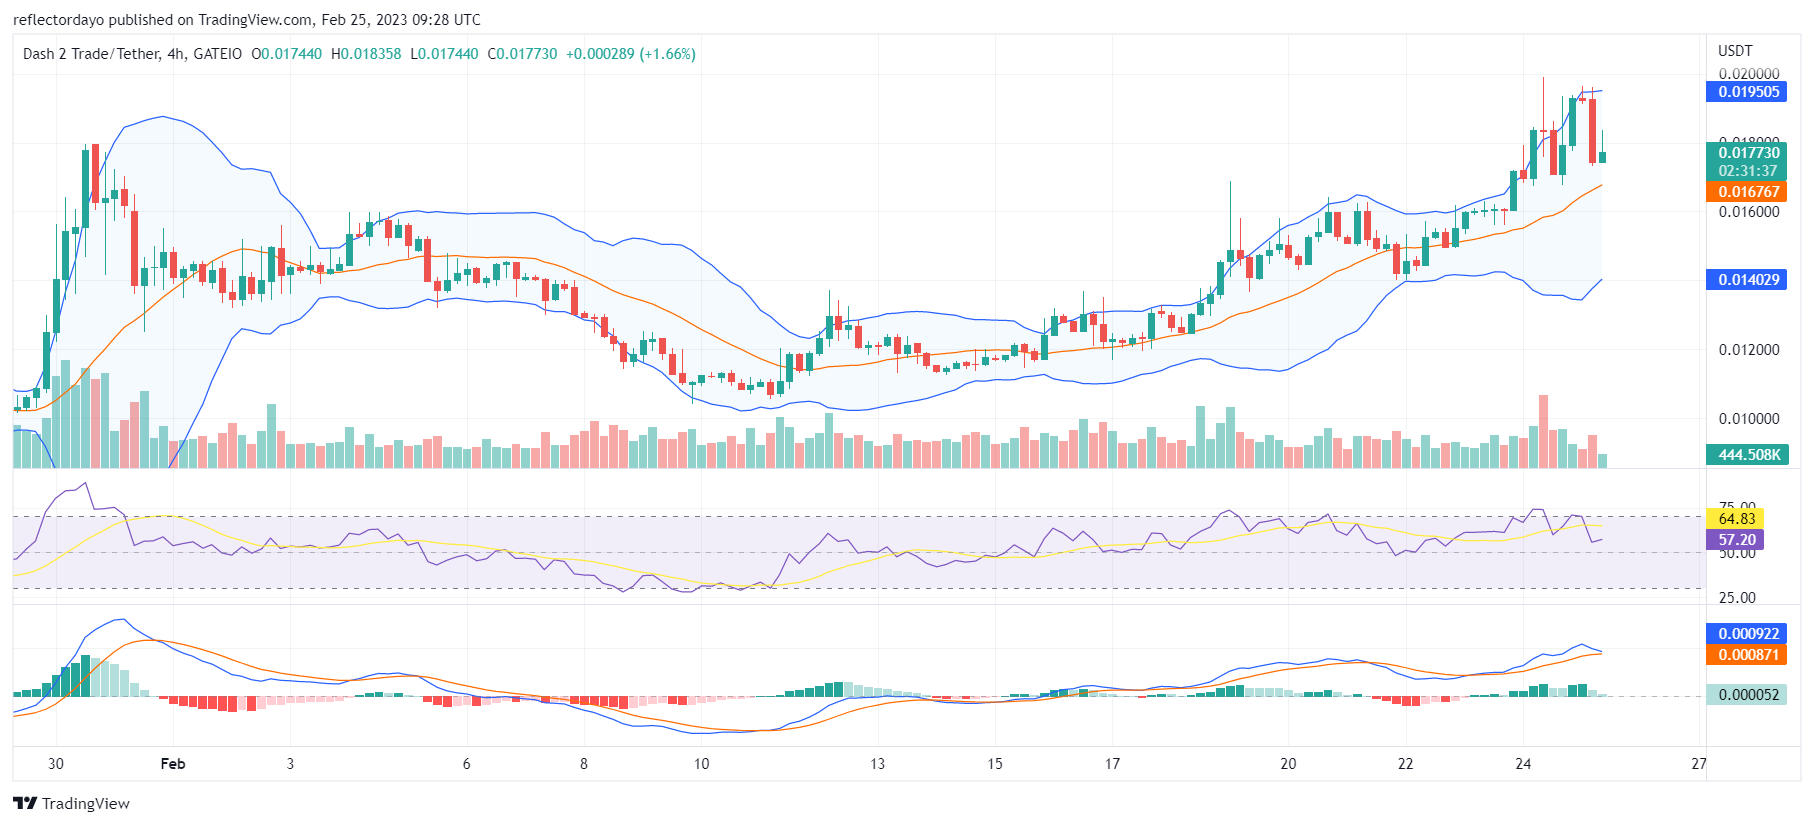
The bullish price was rejected at the $0.0193 resistance price level, and it resulted in a very significant bearish move. But the sellers fail to continue to push the price as they soon become exhausted, and at the support level of $0.0174, the bull market is bouncing back for more action.
Key Levels
- Resistance: $0.019, $0.020, and $0.025
- Support: $0.010, $0.0076, and $0.005
Dash 2 Trade (D2T) Price Analysis: $0.0193 Resistance Under Pressure
Most of the traders have set their take-profit target at around the $0.02 resistance price level, and that is why we have seen this strong bearish market movement. However, even at this point in time in the market, traders are still buying, and that is why we see the bulls regrouping at $0.0174. According to the Bollinger Bands indicator, the price channel illustrated by its two standard deviations is moving in an upward direction. The distance between the two curves is very wide; this points to increased price volatility. However, the upper standard deviation curve is changing to a horizontal movement. They may face a bit of a challenge at the key resistance level, but it seems the bulls are determined to break the $0.02.

D2T/USD Short-Term Outlook: (1-Hour Chart)
At the current 1-hour daily session, we noticed a very significant deadlock. That may be a sign that the demand zone is weakening, and there is a possibility that the current price might fall even more. The supply zone appears to be gathering more and more momentum. However, the Bollinger Bands indicator and Relative Strength Index of this timeframe support a price consolidation trend.
Use the Dash 2 Trade community and social tools to create a successful trading community. These tools let you monitor and track the social activity of various traders, you will also be able check the sentiment on social media.
⚡️#D2T SOCIAL TOOLS⚡️
Build a winning trading community with the Dash 2 Trade community and social tools that will allow you to check the social sentiment and track the social activity of different #cryptocurrencies! 📊
Buy $D2T at https://t.co/J5q9iuWuAu pic.twitter.com/XLJhOGP3SS
— Dash 2 Trade (@dash2_trade) February 26, 2023
Want a coin that has a huge potential for massive returns? That coin is Dash 2 Trade. Buy D2T now!


Leave a Reply