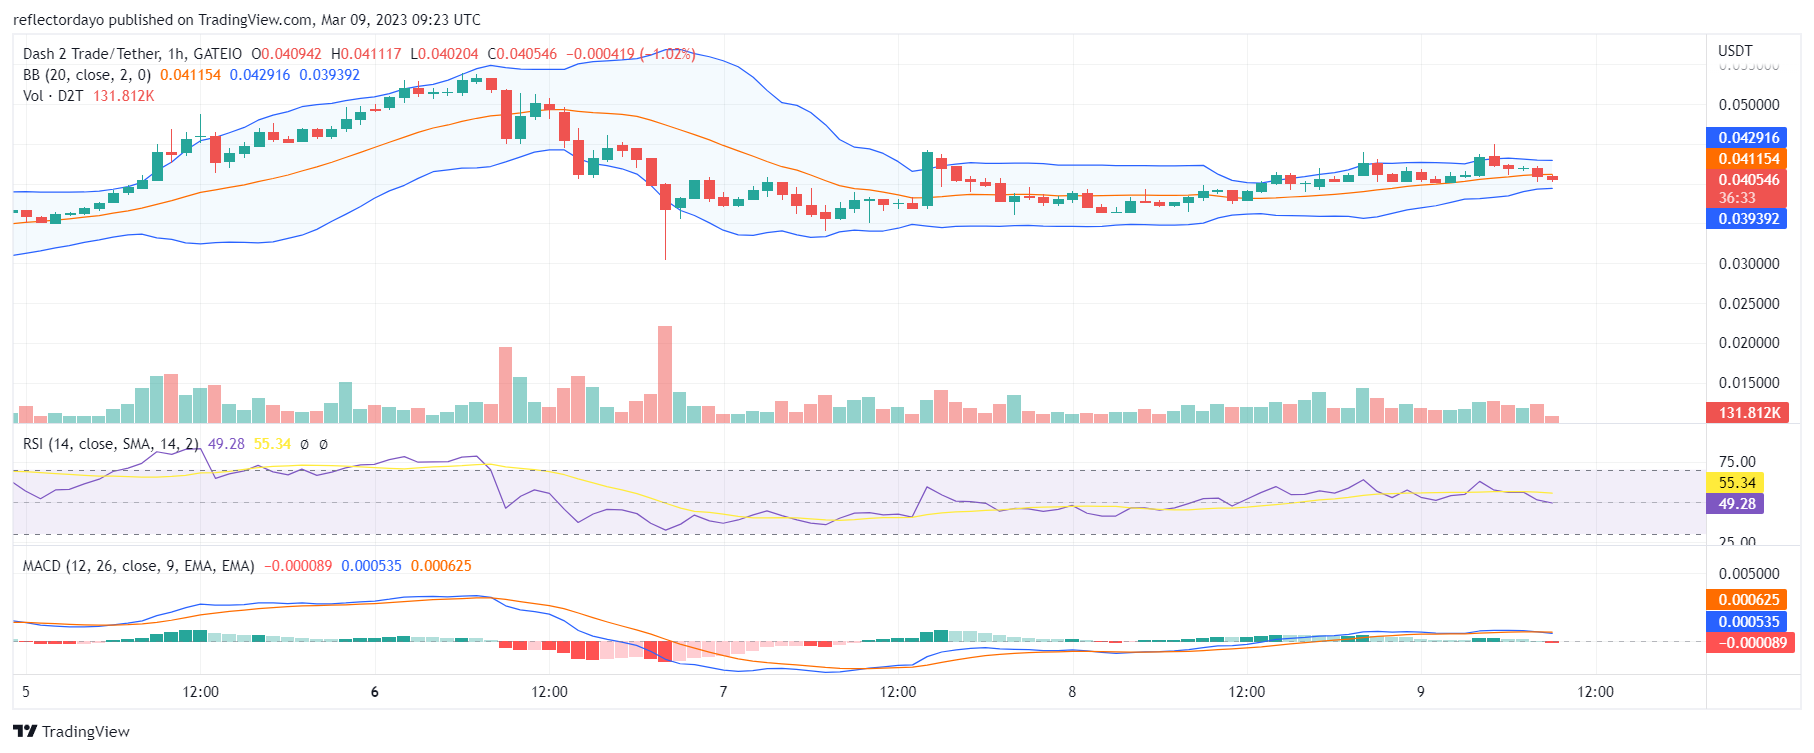
Dash 2 Trade market finally breaks the $0.040 resistance price level, but needs to fight off much resistance at this point. As the demand line gains momentum, it forces the bearish resistance back a bit. Leaving the $0.040 price level, the bears shifted ground to $0.042. At this point, the market is going flat as the buying and selling pressures match up.
Key Levels
- Resistance: $0.060, $0.065, and $0.070
- Support: $0.020, $0.0025, and $0.030
Dash 2 Trade (D2T) Price Analysis: The Indicators’ Point of View—Bearish Resistance Under Pressure
After the bull market broke through the main resistance level, they had to defend their new position because it seems like the bears are ready for more action. But the $0.040 price level has become the bullish support and their new pivot point for targeting new price levels. The Bollinger Bands are convergent due to this deadlock. At the climax of the convergence, we should see a price breakout to the upside. For now, the demand zone has the upper hand over the supply zone, as the Relative Strength Index portrays the market slightly above level 50.

D2T/USD Short-Term Outlook: (1-Hour Chart)
From the 1-hour chart standpoint, we see sellers gathering around the $0.043 price level as they increase the selling pressure. After the appearance of a Doji candlestick, which is indicative of indecision or a possible trend reversal, we saw the bear market in action. The bulls had to retreat and find refuge at the key support level as the pressure came back to them. Keeping a firm grip on this key level will ensure that, when the price breaks out, it will be to the upside.
With Dash 2 Trade’s advanced features, executing profitable market strategies automatically becomes easy.
Start achieving your goals with #D2T 📈
Our advanced features make it easy to build and execute profitable strategies on auto-pilot, so you can sit back and let us do the hard work for you.
💪Join now⬇️https://t.co/J5q9iuWuAu pic.twitter.com/lOYcfvGPID
— Dash 2 Trade (@dash2_trade) March 9, 2023
Do you want a coin with a great potential for enormous returns? Dash 2 Trade (D2T) is that coin. Buy D2T now!


Leave a Reply