Defi Coin Price Forecast: August 5
We could likely see a further shift in the trend to the upside if all the support holds in place and resistance broke out of the $0.1243 level. DEFCUSD may likely reverse to the upside and reach a significant level of $0.1250.
DEFC Price Statistics Data:
DEFC price now: $0.1236
DEFC market cap: $12.21M
DEFC circulating supply: N/A
DEFC total supply: $100.00M
DEFC Coinmarketcap ranking: #6403
Key Levels:
Resistance Levels: $0.1200, $0.1300, $0.1400
Support Levels: $0.1100, $0.1000, $0.0980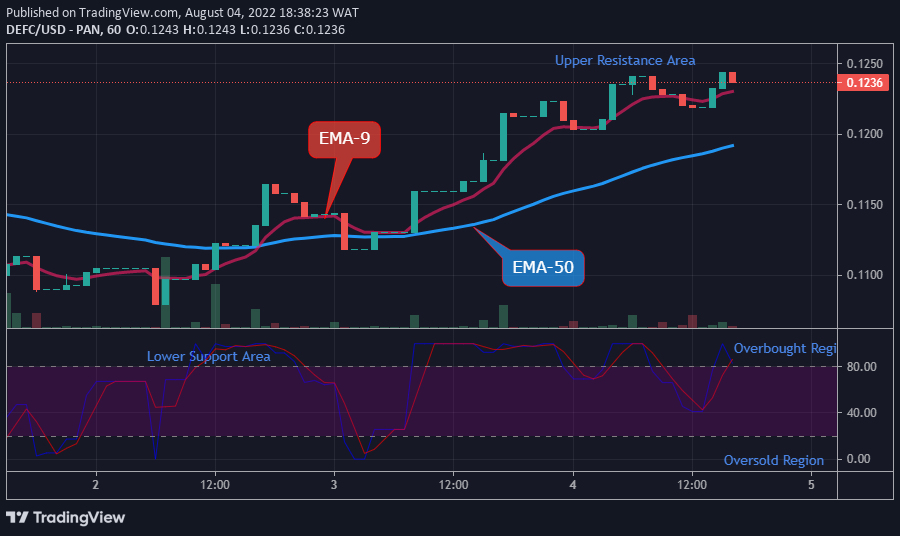 DEFCUSD Long-term Trend: Bullish (1-hour chart)
DeFi Coin is in a bullish trend in its long-term view. The bulls caused a rise to the $0.1243 level after which the sellers intervened and dropped the price down to a $0.1236 low level as the 1-hourly chart opens today.
The market price of DEFCUSD trading above the moving averages suggests that the bears are weaker and the bulls are set now to take us up to a significant level. This, however, may give the buy traders the motive to influence the price tendency.
Therefore, if the bulls increase their tension in the market, the price tendency will move above the key levels in the long-term perspective.
DEFCUSD Medium-term Trend: Bullish (15-Minute Chart)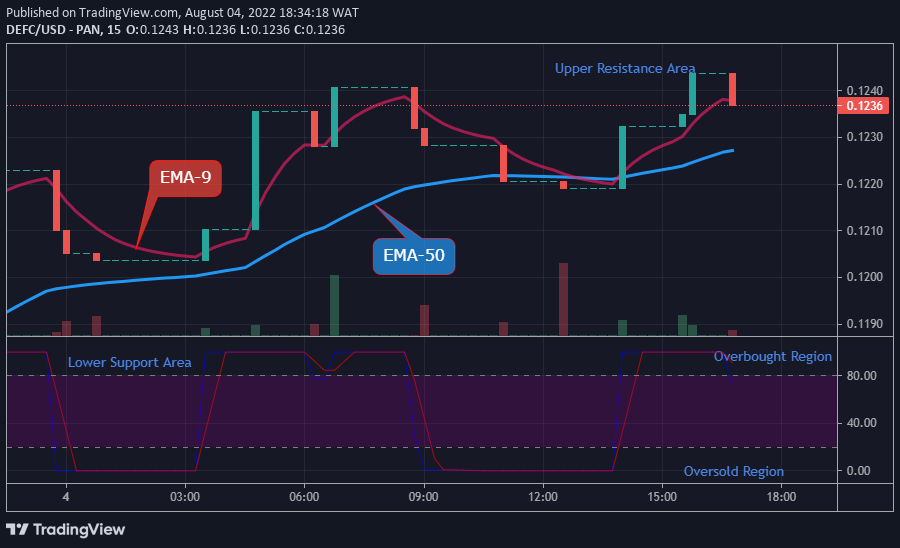 DEFC Price to Remain Bullish
The market value of DeFi Coin on the lower time frame (15 minutes) at $0.1236 is seen above the moving averages. This means that the market is in a bullish trend zone. The market was propelled higher by the bulls until it reached a new high of $0.1243 resistance value.
As a result of price rejection at this level, there was an immediate reversal. Sellers drove the price lower to a $0.1236 low level above the moving averages.
Buyers must redouble their efforts to forecast a bullish increase in the market above the current price level so as to reach a significant level of $0.1250 in the resistance area soon as momentum continues to appreciate in its lower time frame.
You can purchase DeFi Coin here. Buy DEFC

Leave a Reply