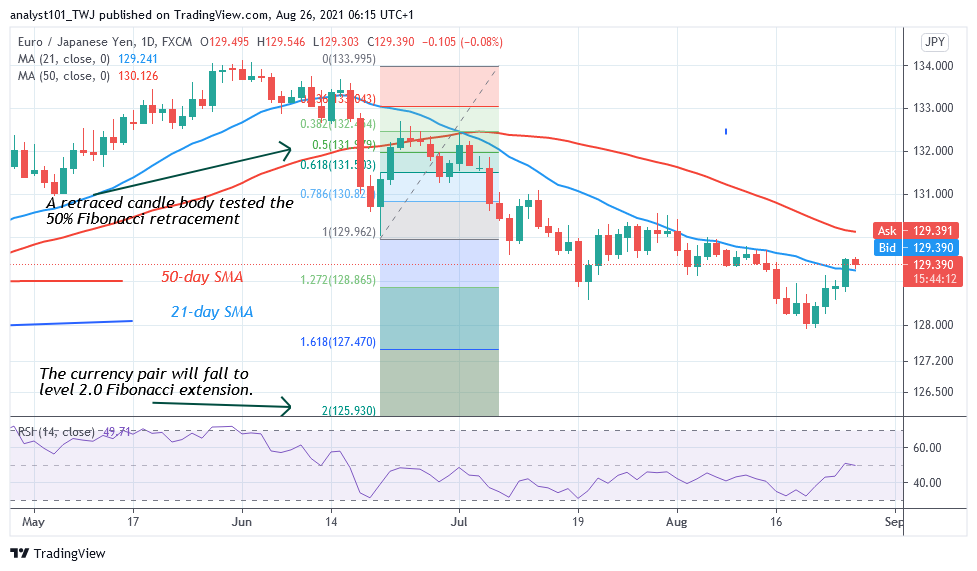
EUR/JPY Long-Term Analysis: Bearish
Since August 20, EUR/JPY has been correcting upward to resume an uptrend. The currency price has broken above the 21-day SMA but faces rejection at the 50-day SMA. A break above the moving averages will signal the resumption of the uptrend. However, rejection at the recent high will prolong the bearish trend. Meanwhile, on June 21 downtrend; a retraced candle body tested the 50% Fibonacci retracement level. The retracement indicates that the pair will fall to level 2.0 Fibonacci extensions or level 125.93.
EUR/JPY Indicator Analysis
The pair has fallen to level 49 of the Relative Strength Index period 14. It indicates that there is a balance between supply and demand. The 21-day and 50-day SMA are sloping downward indicating the downtrend. EUR/JPY is above the 80% range of the daily stochastic. It indicates that the currency pair has reached the overbought region.
Technical indicators:
Major Resistance Levels – 133.00, 134.000, 135.000
Major Support Levels – 128.000, 127.000, 126.000
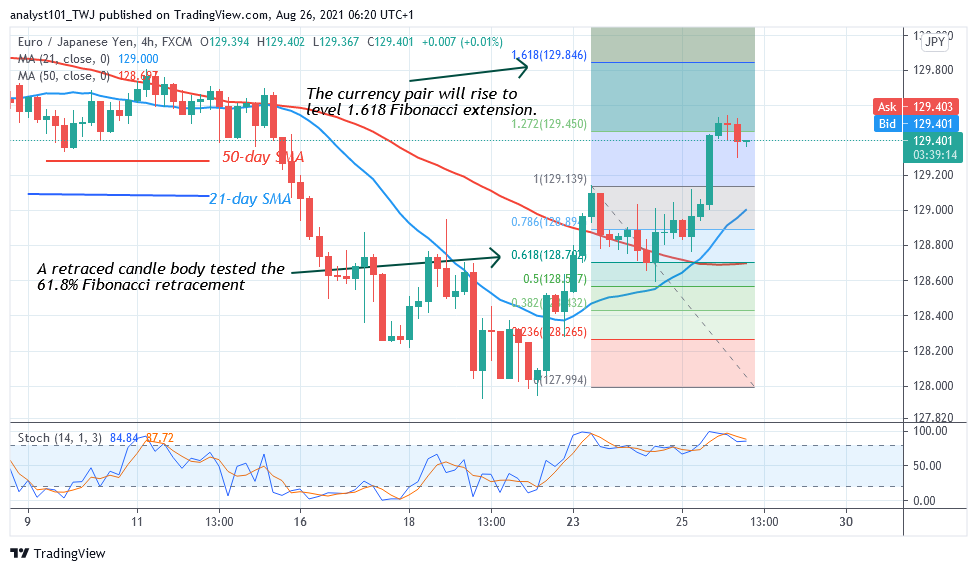
What Is the Next Direction for EUR/JPY?
On the 4 hour chart, the currency pair is in an uptrend. On August 23 uptrend. a retraced candle body tested the 61.8% Fibonacci retracement level. The retracement indicates that EUR/JPY will rise to level 1.618 Fibonacci extensions or level 129.84. From the price action, the pair has reach level 129.50 but it is facing rejection at the recent high.
Note: Forexschoolonline.com is not a financial advisor. Do your research before investing your funds in any financial asset or presented product or event. We are not responsible for your investing results

Leave a Reply