EURCHF Analysis – The Price Structure Tends Towards a Bullish Outlook
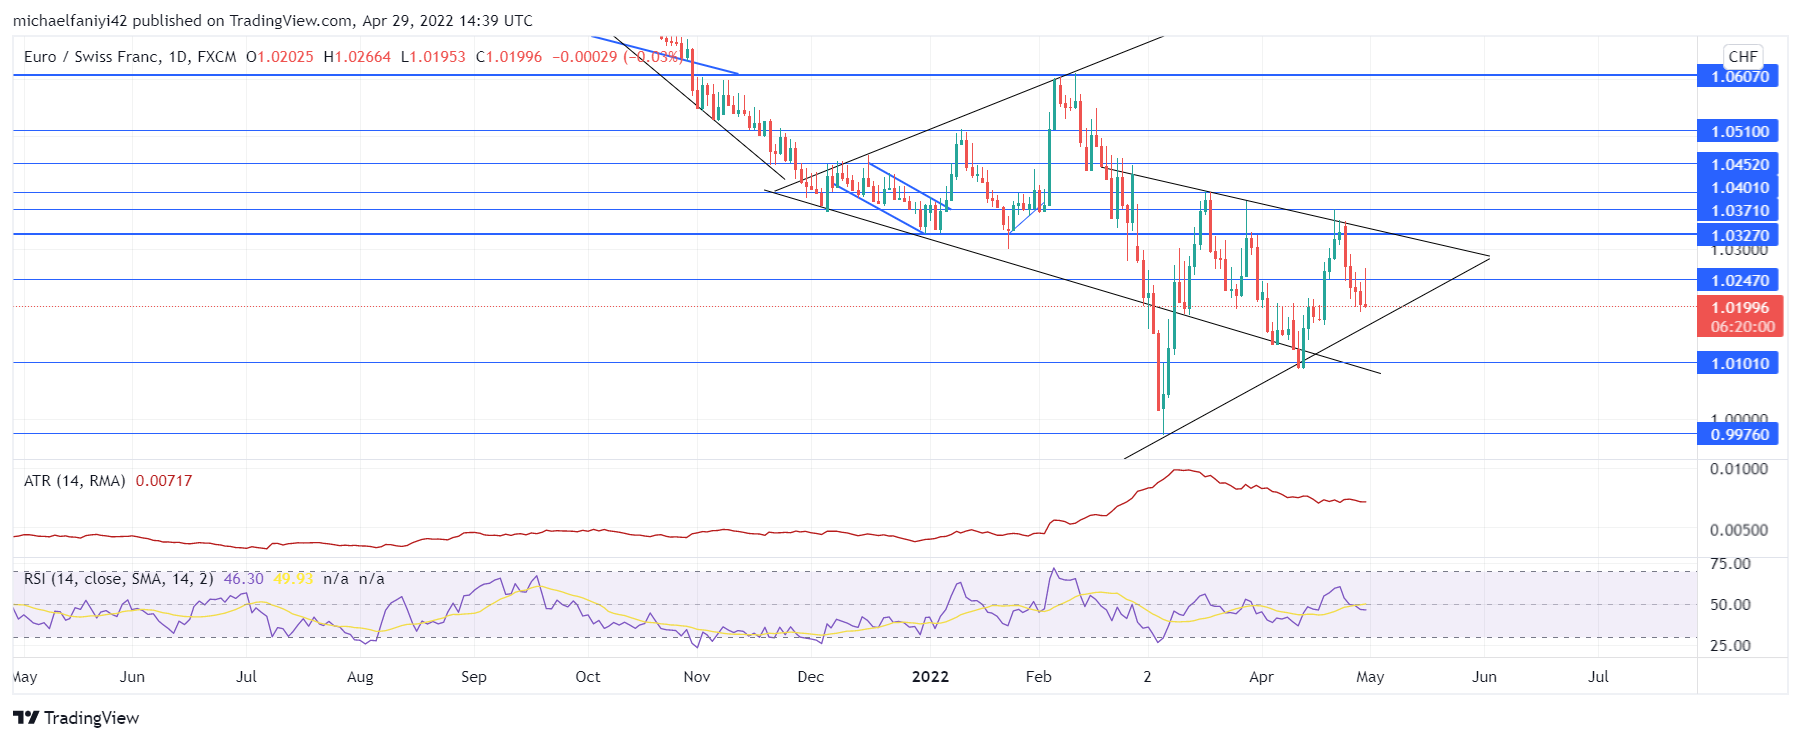
EURCHF price structure is tending towards a bullish outlook as buyers attempt to wrest back control of the market. The price has tempered its momentum after an initial volatile drop below the expanding triangle formation of the market. EURCHF is now slowly tapering in its movement to conform to a symmetrical triangle pattern. The market structure suggests that the price will look to break to the upside.
EURCHF Important Zones
Resistance Zones: 1.02470, 1.03270
Support Zones: 0.99760, 1.01010 Sell-traders have shown much resilience to recover from the hurdle set by the buyers around the 1.03270 price level. This they did by forcefully plunging the market beyond the borders of the market structure at the beginning of March. Since then, the market has recovered from the stretch, and the price now trades close to the lower border of the expanding triangle.
However, the price action movement shows that the bulls have another trick up their sleeves. The candlesticks are increasingly being compressed into a symmetrical triangle shape, which tends to an upward breakout. A combination of reduced volatility as shown by the ATR (Average True Range) indicator and an upward trending RSI (Relative Strength Index) signal line works together for a bullish outlook on the market.
 Market Expectations
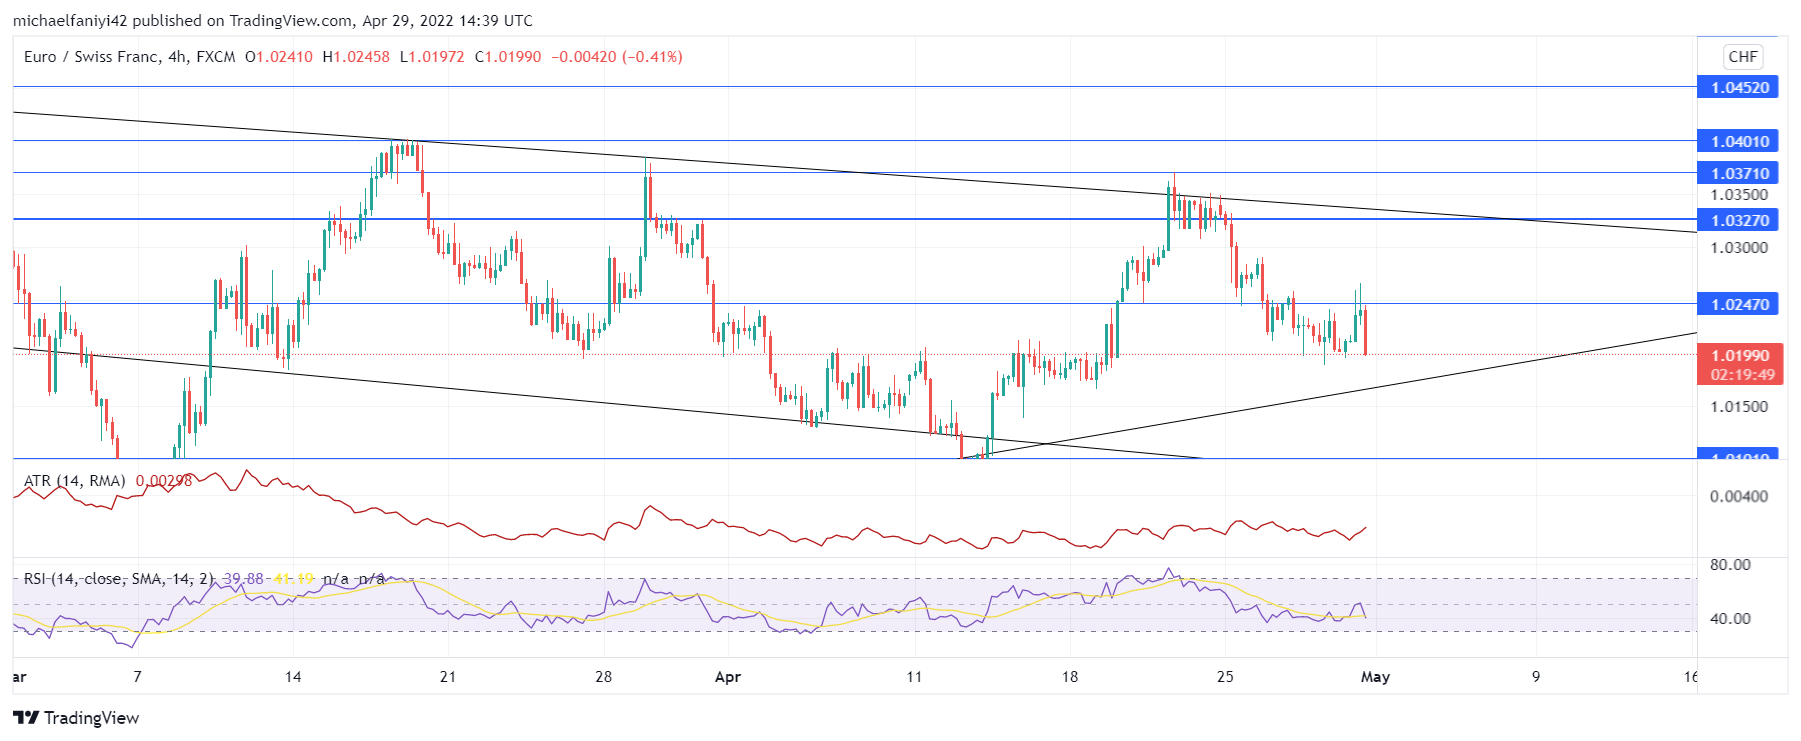
The 4-hour chart shows that the price is currently upward abounding after bouncing off a confluence of trendlines and the 1.01010 support level. While the volatility is wobbling in the short time frame, the RSI line is negotiating the middle level to go up. Also, the candlesticks are trying to bypass the 1.02470 level, after which they will aim to break beyond the upper border of the triangle and the 1.03270 level for higher levels.
Note: Forexschoolonline.com is not a financial advisor. Do your research before investing your funds in any financial asset or presented product or event. We are not responsible for your investing results.


Leave a Reply