EURUSD Major Zones
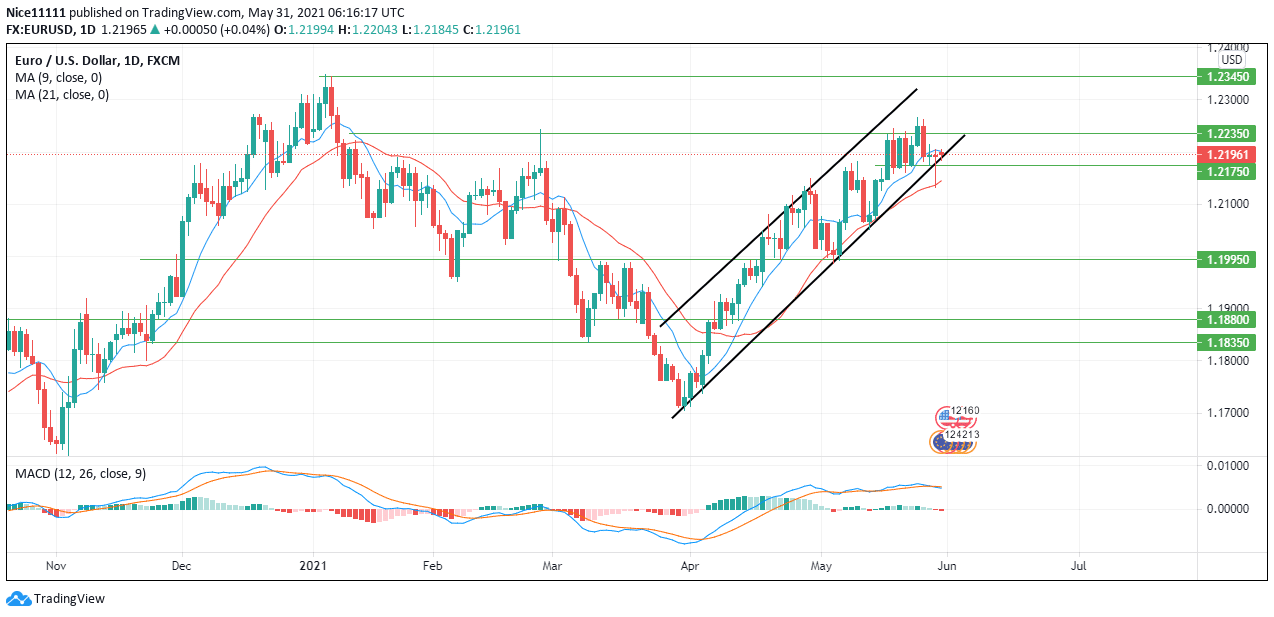
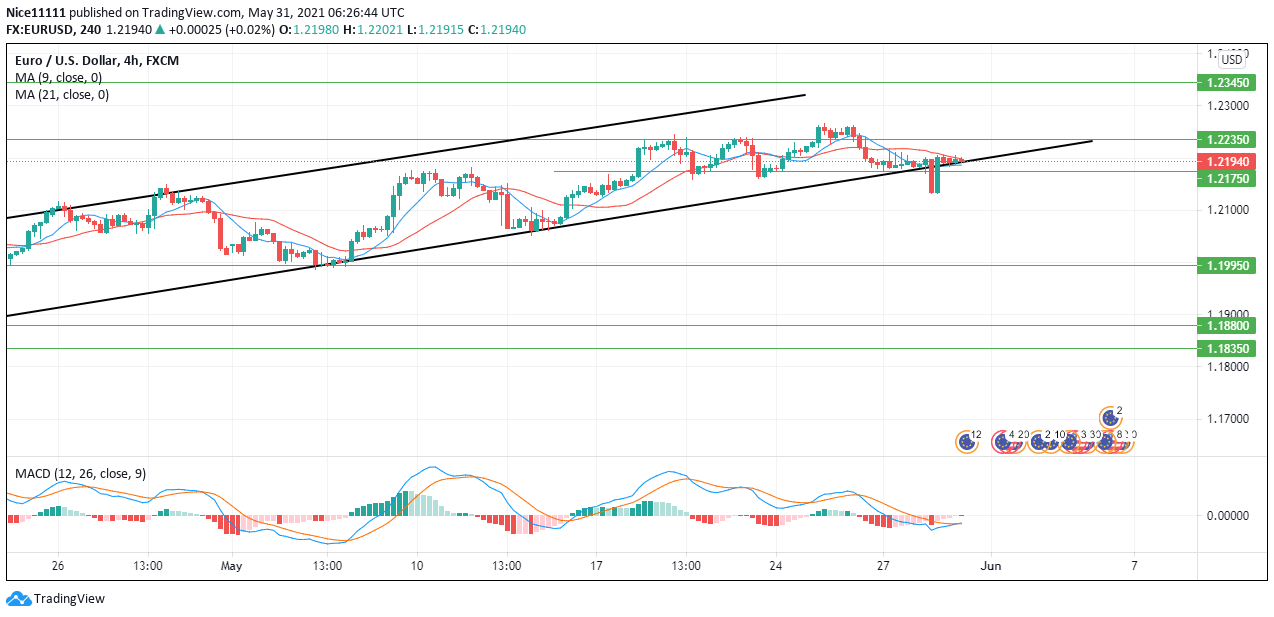
Demand Zones: 1.18350, 1.18800, 1.21750
Supply Zones: 1.23450, 1.22350, 1.19950
Market Analysis of EURUSD
The market has been seen to trade higher since the 31st of March 2021. The bullishness of the market is very clear with distinct highs and lows. EURUSD bullish run has successfully traded through previous demand and supply zones. The market is currently defending the 1.22350 supply zone. This is seen as multiple candlesticks line up side by side under the resistance zone. The 9 Simple Moving Average (blue) and the 21 Simple Moving Average (red) crossed last on the 13th of April. The SMAs have acted as support for the price since the cross.
 EURUSD Market Anticipation
The previous candle on the 28th of May broke through the demand level at 1.21750, its candlewick dipped lower but was supported by the 21Moving Average The drop altered the current market structure. The market has managed to trade through the zone higher in today’s opening. The candles are currently under the 9 Moving Average on the daily chart which is an early sign of weakness in price.
On the daily chart, The MACD (Moving Average Convergence Divergence) has crossed on the upper side showing a strong selling alert. The histogram bars have dropped in size and have shown two red bars signifying a sell. On the four-hour chart, the MAs have crossed to drive the price lower. This is seen with two huge candles smashing through the lower border of the ascending channel.
The MACD on the four-hour chart still gives hope of EURUSD bullish movement to attempt to break through the 1.22350 level. If it succeeds, then it would likely reach 1.23450. However, the weakness of the market should drive the price to 1.19950.
Note: Forexschoolonline.com is not a financial advisor. Do your research before investing your funds in any financial asset or presented product or event. We are not responsible for your investing results.


Leave a Reply