GBP/USD Price Prediction – May 10
In the bid to further strengthen the GBP/USD market downward trend, the currency pair price now pushes past the lower convergence trading spot it kept recently. It has now been observed that the pairing coins trade between wider range-pip differences of about 200. Presently, the market features around 1.2346 at an average minimal percentage of +0.13.
GBP/USD Market
Key Levels:
Resistance levels: 1.2600, 1.2800, 1.3000
Support levels: 1.2300, 1.2100, 1.1900
GBP/USD – Daily Chart
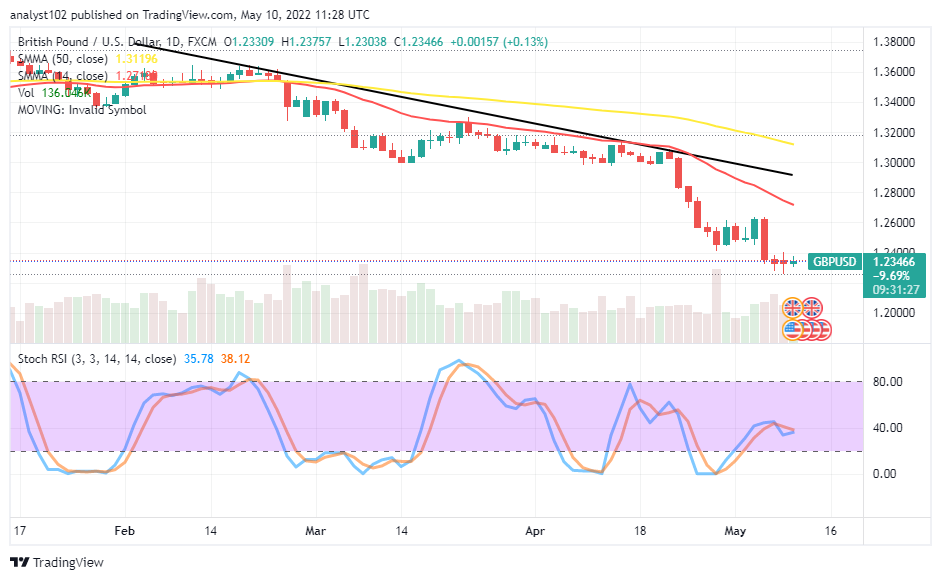
The GBP/USD daily chart reveals the currency pair price pushes past the lower convergence trading spot that it maintained recently. The 14-day SMA indicator is underneath the 50-day SMA indicator. The bearish trend line drew, backing the variant psychological resistant points that will have to break upward while swing highs will have to resurface. The Stochastic Oscillators have sprung northbound from the oversold to slightly consolidate around the range of 40. Is there still an indication that the GBP/USD will go down more?
It still appears that some downs will still materialize in the GBP/USD market as the price has pushed past the lower convergence bargaining spot it maintained previously around the 1.2600 line. A sudden sustainable shoot-up has to occur against the 1.2400 to portend a return of buying signal against the valuation of the US Dollar.
On the downside of the technical analysis, the GBP/USD market sellers have to capitalize on the selling created during the May 5th bearish candlestick that formed downward from the 1.2600 trading level. Traders should always back their execution order with price action to ensure maximum clarity.
In summary, the GBP/USD market operations may still go undervaluing to the downside as long as the price fails to make an aggressive motion upward back past the 1.2600 resistance level. GBP/USD 4-hour Chart
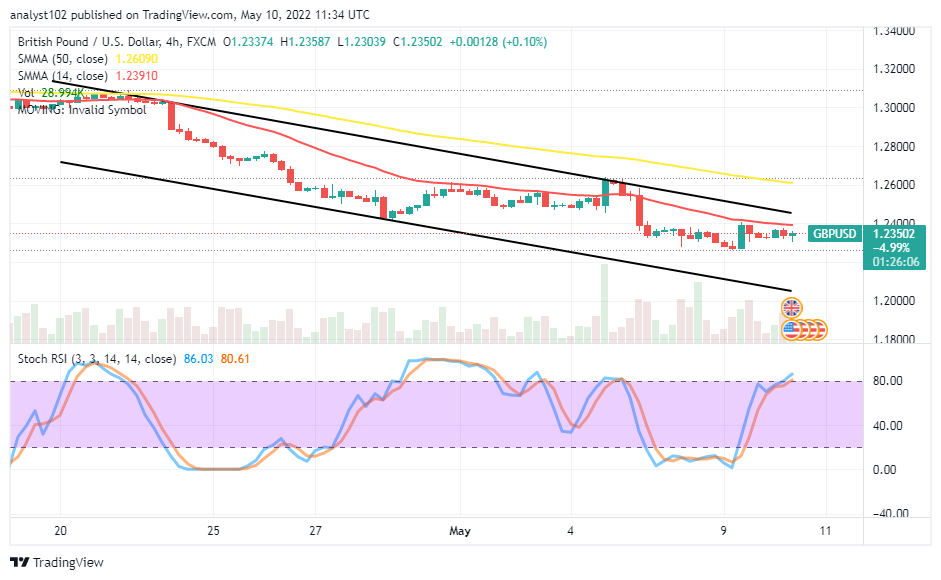
The GBP/USD 4-hour chart showcases the currency pair is downing in the bearish channel trend lines. The 14-day SMA indicator is closely below the upper bearish trend line drawn and, the 50-day SMA indicator is above them, placing a markdown sign around the 1.2600 resistance level. The Stochastic Oscillators are around the range of range, seemingly attempting to close their lines. That raises a probable insight against getting reliable up surging motions in the medium-term run outlook.
Note: Forexschoolonline.com is not a financial advisor. Do your research before investing your funds in any financial asset or presented product or event. We are not responsible for your investing results.


Leave a Reply