NZDUSD Analysis – Market Confluence Zone Is Influential as NZDUSD Breaks Out
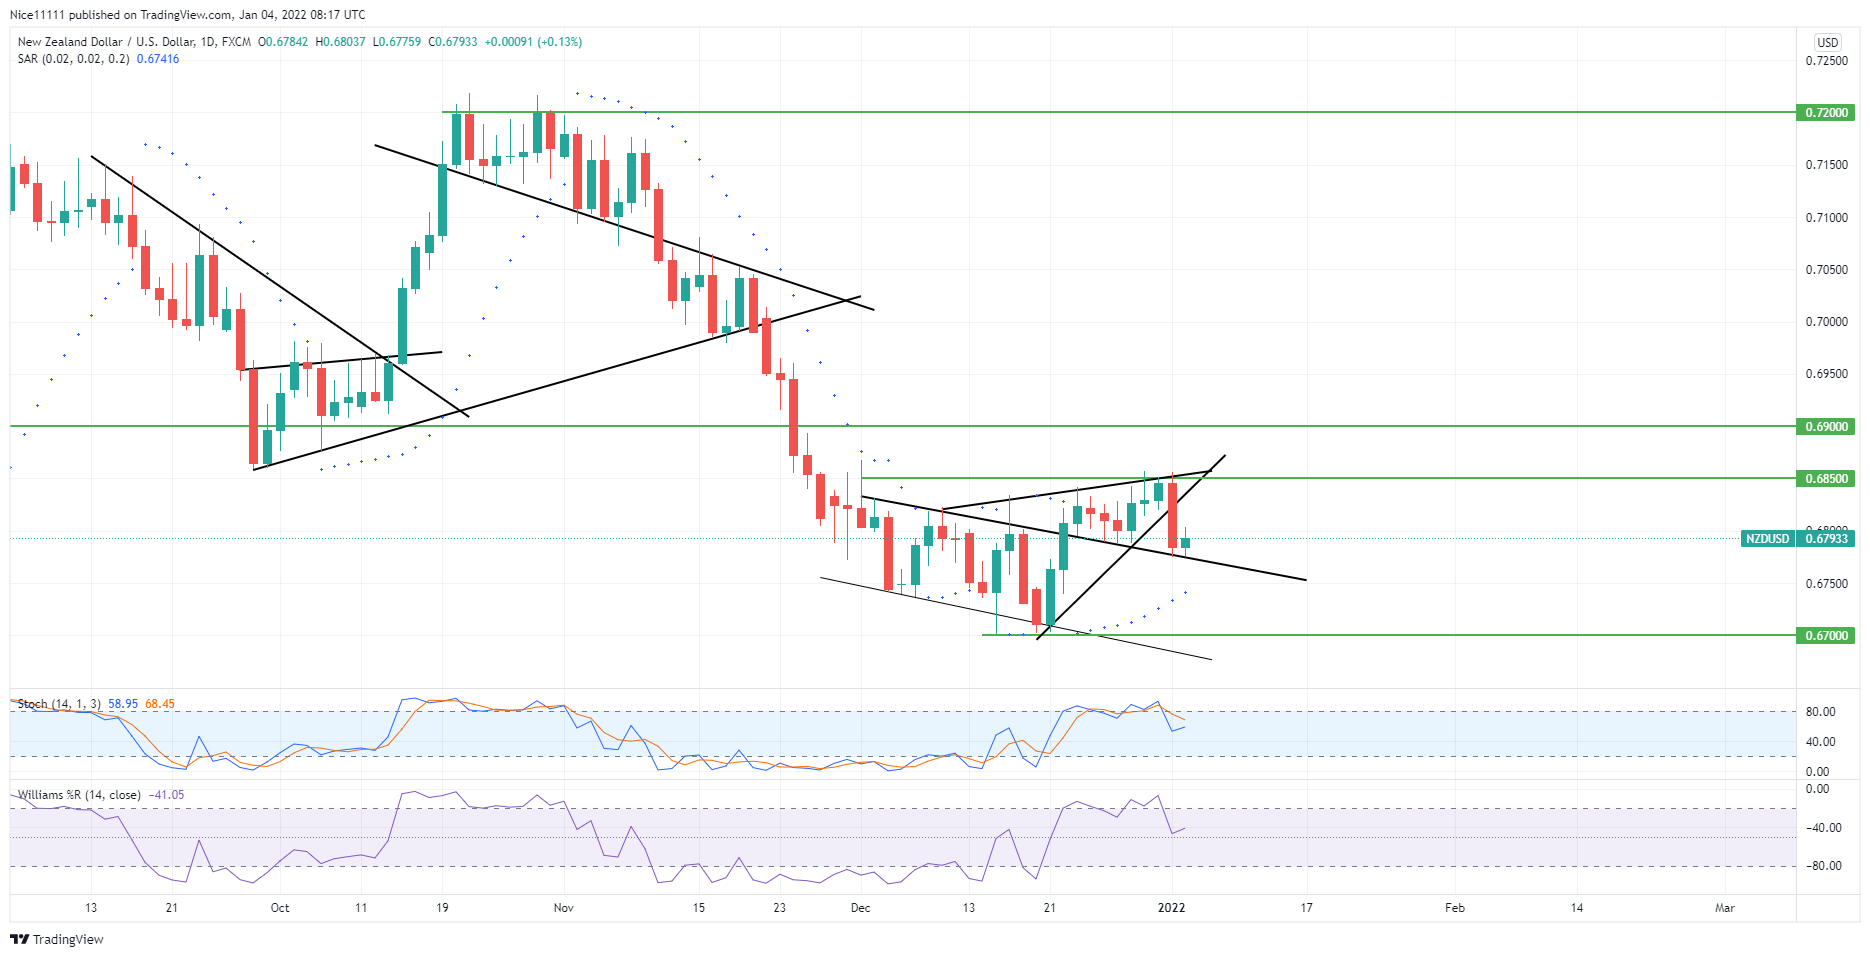
NZDUSD breaks out of its ascending triangle pattern yesterday, January 3rd. The triangle pattern was formed at 0.6850 level, which formed a confluence zone. The market is seen to highly respect the technicals. The demand zone at 0.7200 initiated the bearish run. A trend reversal was created towards the end of November.
NZDUSD Major Market Zones
Demand Zone: 0.6700, 0.6900
Supply Zone: 0.6850, 0.7300 Price breaks out, as seen on the 19th of November, from a symmetrical triangle. The price dipped into the demand zone at 0.6700 on the 15th of December. At that point, the Stochastic Oscillator and the Williams Percent R indicators signaled an oversold market. The price pumped but eventually retraced to test the zone once more.
The descending channel rested on the demand zone. This formed a confluence to support the price. A break out of the channel was fulfilled on the 22nd of December. The market retested the upper border. This pumped the price into another confluence zone. The symmetrical triangle merged with the supply zone. This caused a plunge in the market, violating the ascending triangle.
 NZDUSD Market Expectation
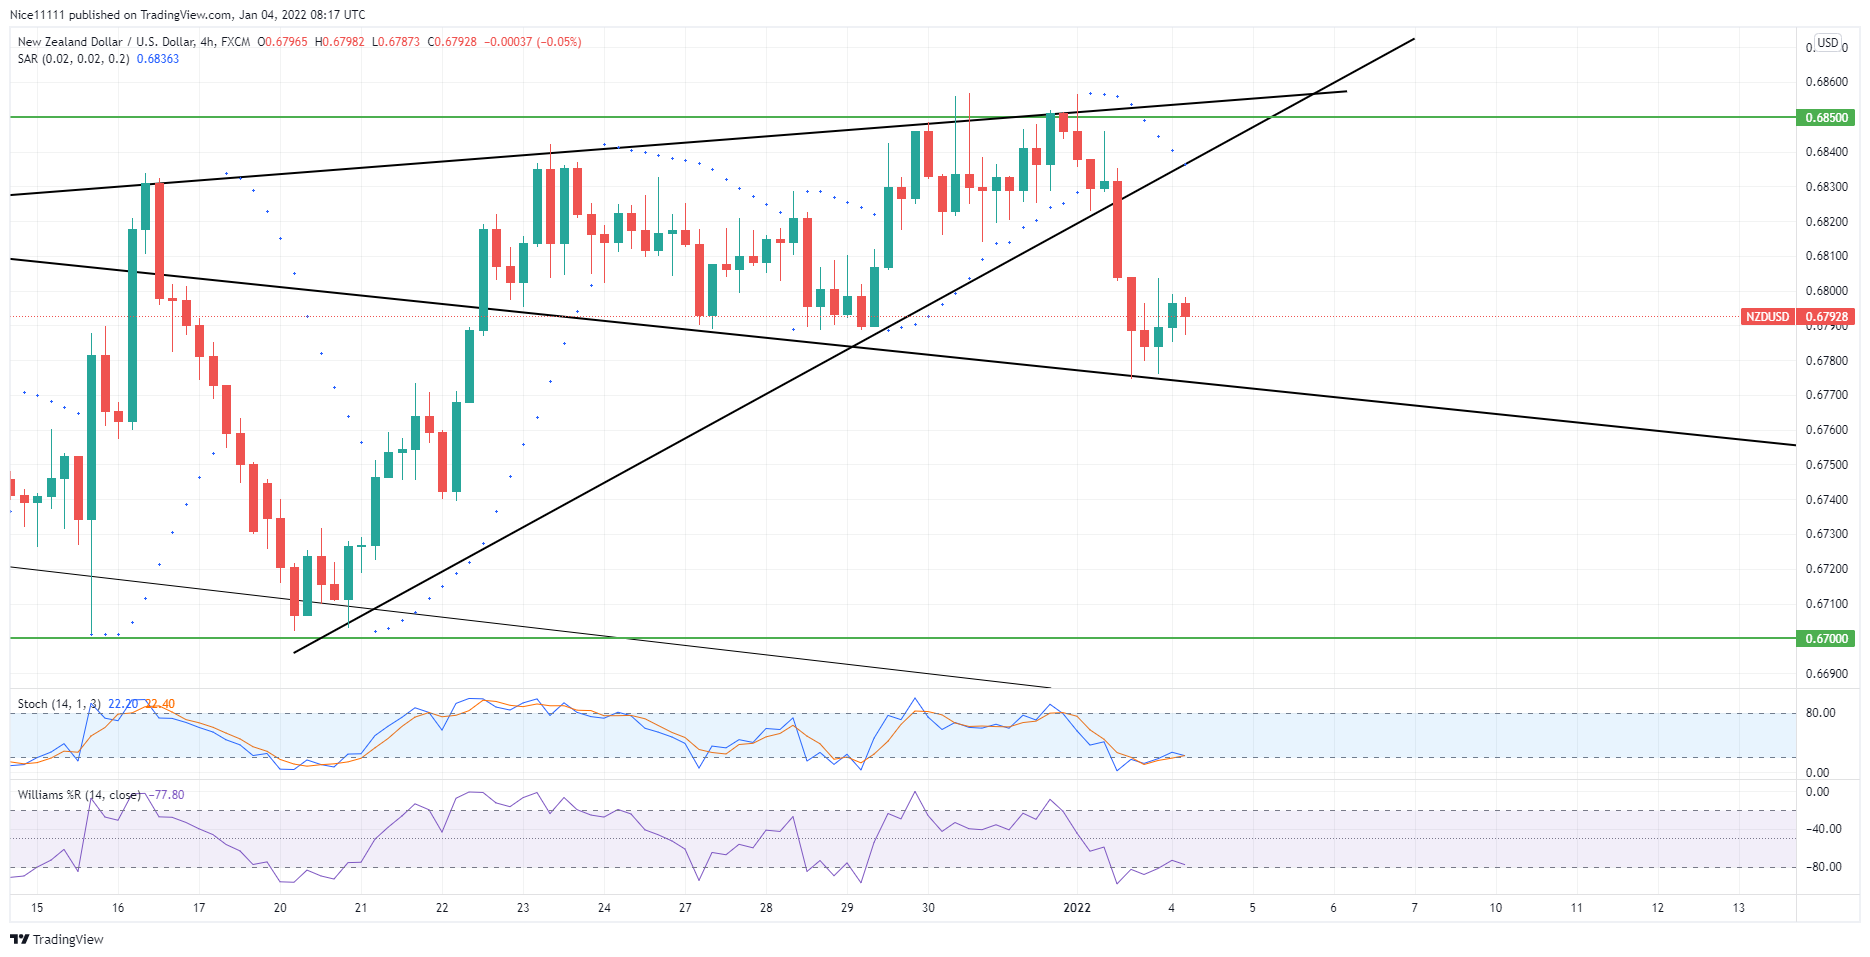
On the 4-hour chart, the trend is bullish. This is seen with the Parabolic (Stop and Reverse) indicator. The Stochastic Oscillator and the Williams Percent R are currently showing an oversold market. The market rested on the top of the downward channel yesterday after the price breaks out. It is likely to use the trend line as support to rise to 0.6850.
Note: Forexschoolonline.com is not a financial advisor. Do your research before investing your funds in any financial asset or presented product or event. We are not responsible for your investing results.


Leave a Reply