Tamadoge Price Prediction – August 22
A lot of trading activities have followed the mode of business transactions between the two market movers, Tamadoge and the US coin, as it has been observed that the crypto market regains stances after finding support near the zone of $0.00750, making it p ush high through some of the recent lost profitable points.
Given the current situation, a series of buying pressures may continue to be tenable throughout time during the moves that are surging upward for recoveries. After those suppositions come true, bulls will need to actively respond to the market in order to sustainably drive past key resistances near the prices of $0.0100 and $0.01100 in the ensuing high-impact movement deals.
TAMA/USD Market
Key Levels
Resistance levels: $0.01000, $0.01100, $0.01200
Support levels: $0.007500, $0.006500, $0.005500
TAMA/USD Medium-term Chart
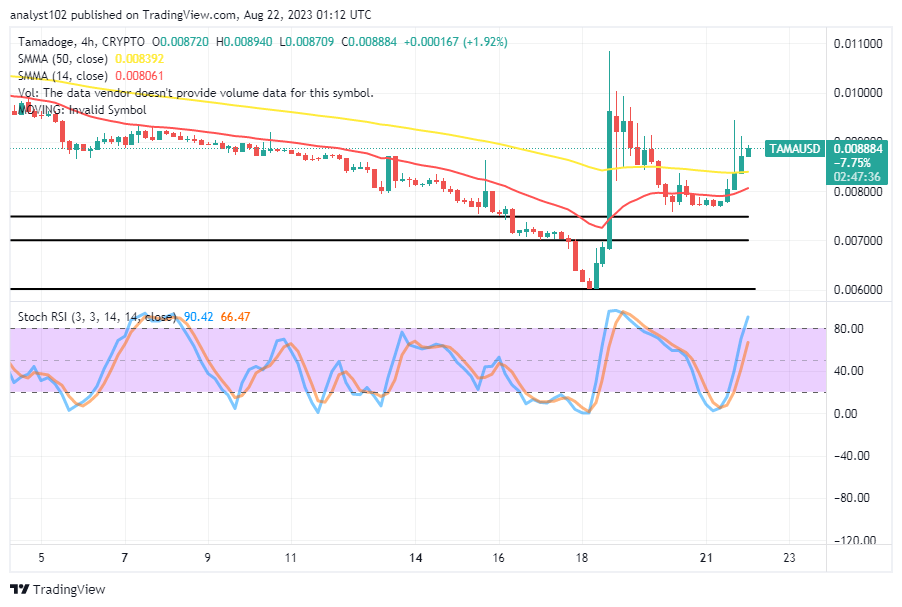
The TAMA/USD medium-term chart reveals that the crypto-economic market regains stances, pushing high through reversal higher lines missed lately from the beneath of $0.01100 at a closer point.
The 14-day SMA is positioned at the $0.008061 level to point slightly northward at a nearby region below the 50-day SMA, which is located around the $0.008392 level. This positioning posture of the indicators suggests a promising return to a bullish trading set. The Stochastic Oscillators are situated between 66.47 and 90.42 after having moved northward from an oversold area.
What is the current TAMA/USD market’s likely remaining force percentage in the upside direction?
Trying to answer the above technical trade question, the stochastic oscillators have most of the time been the instrument used to denote the possible remaining transaction capacity forces at a given time given that the TAMA/USD market regains stances from a near spot above $0.007500 to push high for recoveries.
Currently, it has been predicted on average that bulls will push back upward to the most recent high, which is close to the resistance line around $0.01100, before any potential retracement can be seen again later. Whatever happens, our judgment remains the same in regards to the strategy of ongoing purchases of cryptocurrencies relative to US dollars because enormous profits are expected to be made prior to upcoming trade sessions at higher value levels.
TAMA/USD Short-term chart
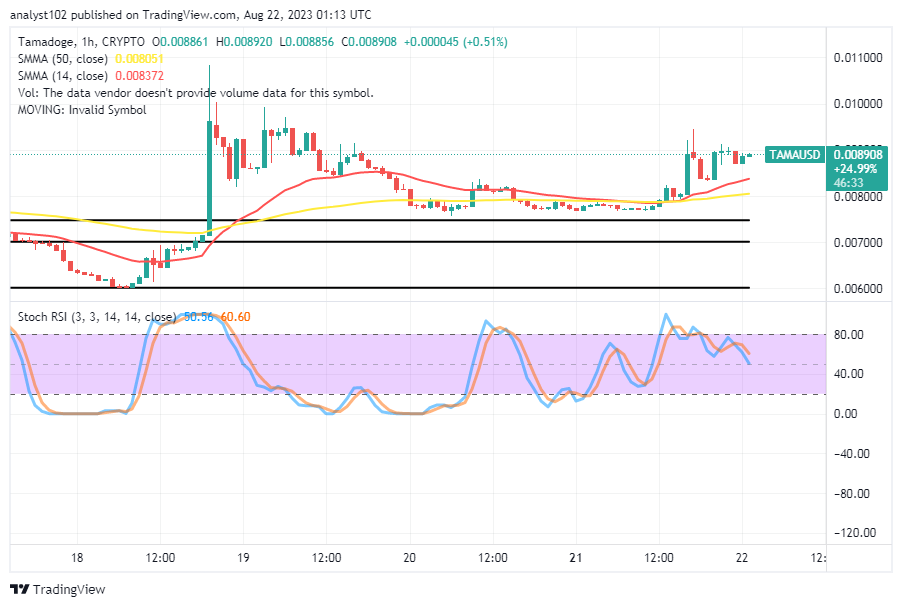
The TAMA/USD short-term chart showcases the crypto market’s regained stance, pushing high from a tight lower zone beneath the trend lines of the moving averages.
The 50-day SMA indicator and the 14-day SMA indicator originally crossed in a little southerly direction before turning back in a northerly direction to produce a range of $0.008051 to $0.008372. However, a line of candlestick formation at this moment indicates that the price is comparatively experiencing a rejection at the amount of $0.009000. Systematically conjoining their lines in a southerly direction from a portion of the overbought region, the stochastic oscillators have values between 60.60 and 50.56. However, it has been determined that the market is currently battling between $0.00800 and the latter mentioned to determine the next course of action as soon as feasible.
We’ll never stop providing you with the best Web3 games! Visit the iOS and Google Play stores to look for our two newest apps, Tamadoge Arcade and Tamadoge Arena.
We keep bringing you the very best in web3 gaming! Search our new apps, Tamadoge Arcade and Tamadoge Arena, in both the iOS and Google Play stores 😍 pic.twitter.com/zvIl7YbVHg
— TAMADOGE (@Tamadogecoin) August 21, 2023
Do you want a coin that would 100X in the next few months? That is Tamadoge. Buy TAMA today
Note: Forexschoolonline.com is not a financial advisor. Do your research before investing your funds in any financial asset or presented product or event. We are not responsible for your investing results.


Leave a Reply