Tamadoge Price Prediction, March 9
Some erratic moves have continually staged in the market valuation of Tanmadoge versus the US Dollar, given that the crypto-economic trade waggles up, holding positive inputs.
A small price movement has occurred, pushing the market slightly to the north following the upper Bollinger Band trend line’s course. The idea that purchasing pressures will eventually win acceptance is becoming more and more apparent, even if it means creating longer delays.
TAMA/USD Market
Key Levels
Resistance levels: $0.0090, $0.010, $0.011
Support levels: $0.007, $0.0065, $0.006
TAMA/USD Medium-term Chart
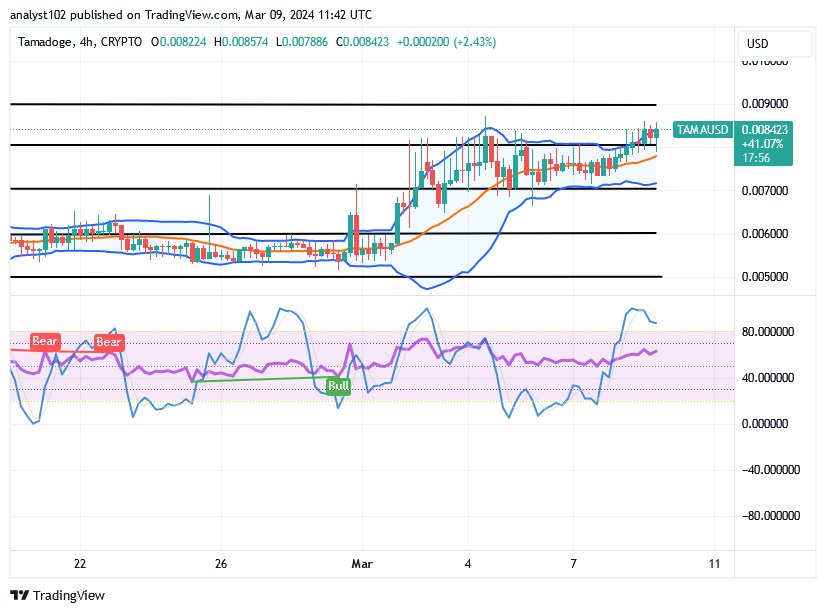
The TAMA/USD medium-term chart reveals that the crypto-economic market waggles up, holding positive inputs.
The Bollinger Band trend lines have sprung to the north side to position averagely at the upper side beneath the value lines of $0.009 resistance, leaving the lower part to place around the support of $0.007. The stochastic oscillators have had the blue line placed in the overbought region to indicate that buyers are relatively at the top of the market.
Will the TAMA/USD market get pushed more steadily alongside the upper Bollinger Band in the next moves from the current point of $0.008423?
If long-position pushers resort to moving in a strong consolidation manner from the point of $0.008, the TAMA/USD market will systemically be driving higher, as the situation is such that the price waggles up, holding positive inputs.
The chart currently shows that the upward pressure is apparently becoming too great to warrant a trade pause. It would be psychologically optimal for long-position takers to be aware of initiating orders in the direction of the volatility index that would be generated if the scenario tends to hold for days. However, investors still face a great deal of obstacles to overcome in order to realize value appreciation across a wider range of time horizons.
TAMA/USD short-term chart
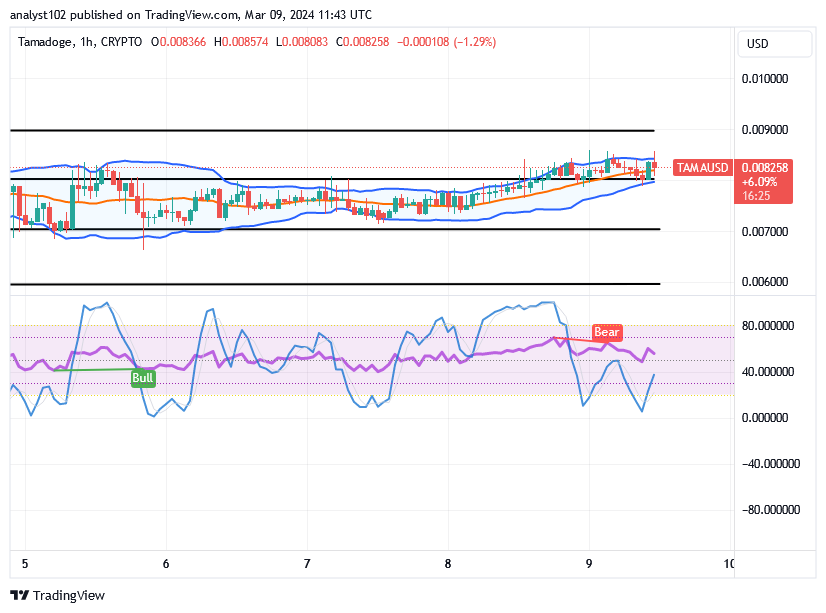
The TAMA/USD short-term chart showcases how the crypto market waggles up alongside the path of the upper Bollinger Band, holding positive inputs.
Essentially, two horizontal lines have been drawn, one at $0.007 to establish the baseline and the other at $0.009 to indicate a resistance point where the Bollinger Bands have been embodied. Additionally, different candlesticks with a weak opposing signal to the south are forming inside the indicators. The stochastic oscillators are waving from the bottom end to show that a sequence of tentative climbs is in place.
Play any of our games to receive your weekly TAMA. To increase it even further, you can then stake it.
Gaming = Earning
— TAMADOGE (@Tamadogecoin) January 6, 2024
Play any of our games to earn your weekly $TAMA and then stake it to increase it further. pic.twitter.com/RvVihN7jzx
Do you want a coin that would 100X in the next few months? That is Tamadoge. Buy TAMA today
Note: Forexschoolonline.com is not a financial advisor. Do your research before investing your funds in any financial asset or presented product or event. We are not responsible for your investing results.


Leave a Reply