Market Analysis – USDCHF Fails to Bypass the 0.92000 Resistance
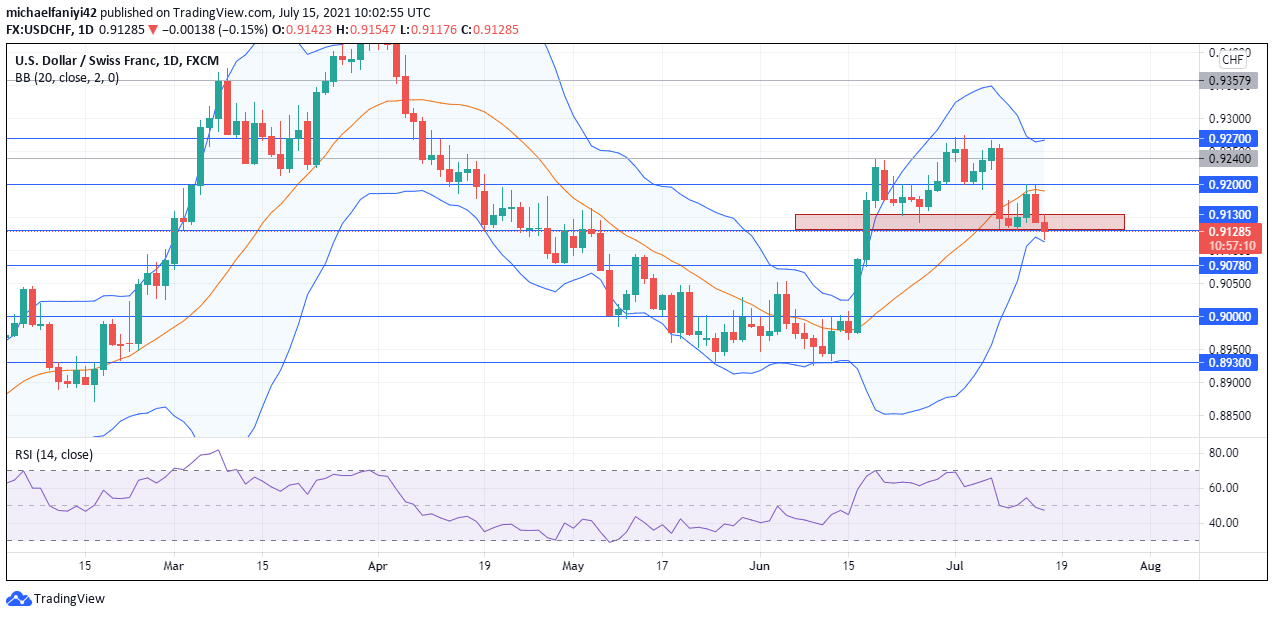
USDCHF fails to continue the bullish movement and presents a tweezer top candle formation to go lower. The market has similarly presented a tweezer top candle formation at 0.92400 supply level on the 18th of June 2021. What followed was a fall in price below the next supply level. The bulls then worked to push the price up again from the 28th of June 2021.
The market reached 0.92700 weekly resistance was rejected to 0.92000 at which it bounced up for a retest. The retest, however, knocked the price down totally to the 0.91300 demand zone. USDCHF fell to the demand zone at 0.91300 at which buyers tried to rally again. It is at this point that the price moved up to hit 0.92000 with a tweezer top for a drop. The price opened today with a bearish candle that has fallen below the 0.91300 demand zone. The middle line of the Bollinger Band indicator has been very precise in showing market movements. From the 6th of April 2021 to the 16th of June 2021, the line moved above the daily candles to show bearish movement. From there it moved below to indicate bullish movement. The line has now switched once more above the daily candles. The RSI (Relative Strength Index) indicator also signals a change to bearish movement as its signal line is now plunging.
USDCHF Key Zones
Supply Zones: 0.92700, 0.92000, 0.91300
Demand Zones: 0.90780, 0.9000, 0.89300
 Market Expectations
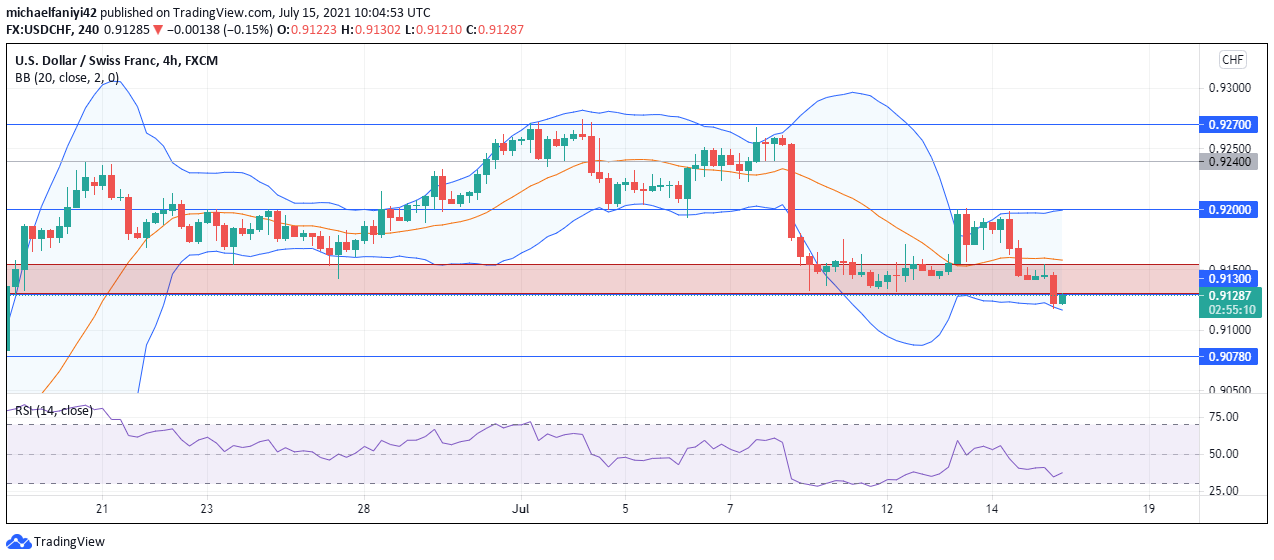
On the 4-hour chart, the market has fallen below the demand zone at 0.91300. The market is now making a retest of the zone. The retest is likely to push the price further down to 0.90780 for decision-making. But if the buyers remain adamant, the market might just move back upwards and return to being bullish. The RSI is at 39.07 and points upwards to show market retracement.
Note: Forexschoolonline.com is not a financial advisor. Do your research before investing your funds in any financial asset or presented product or event. We are not responsible for your investing results.


Leave a Reply