Weekly Price Action Trade Ideas – 3rd to 8th Feb 2019
Markets Discussed Today: EURUSD, CADJPY, EURJPY and GOLD.
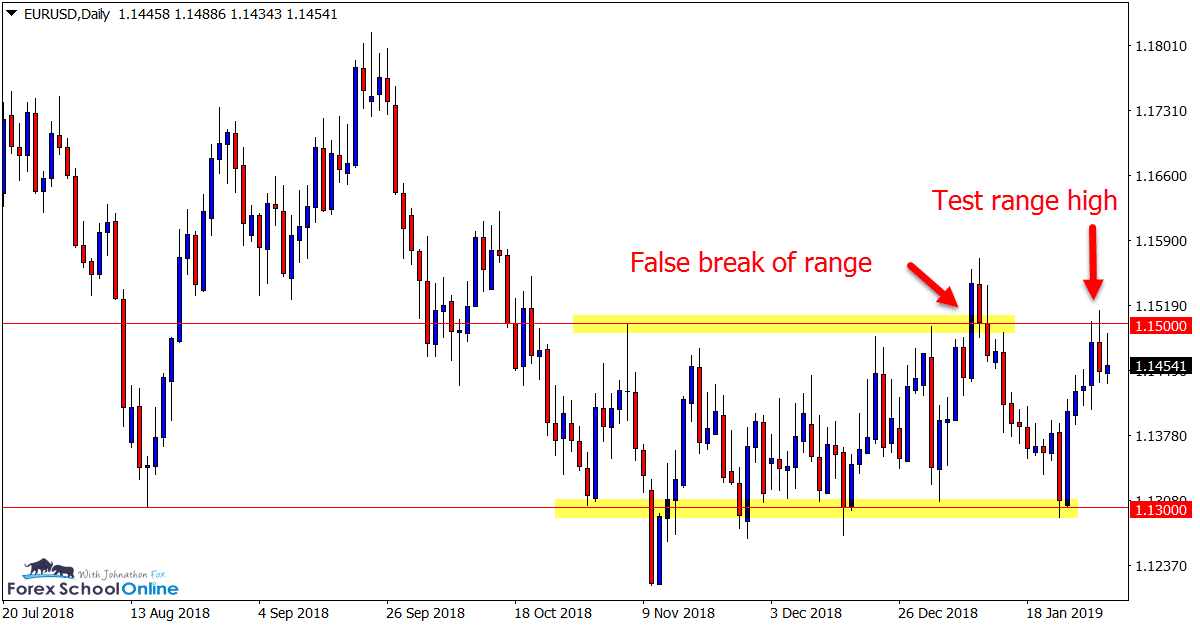
EURUSD Daily Chart
Intraday Engulfing Bars
This is a market we have been discussing quite a bit of late because it has been stuck inside a tight box range.
After pushing off the support lows with a large rejection, price this week made its way into the range high resistance.
Previously price attempted to snap and breakout higher through this level, only to false break and slam back lower.
Whilst the range and box holds, we must trade what we see and the major levels in front of us.
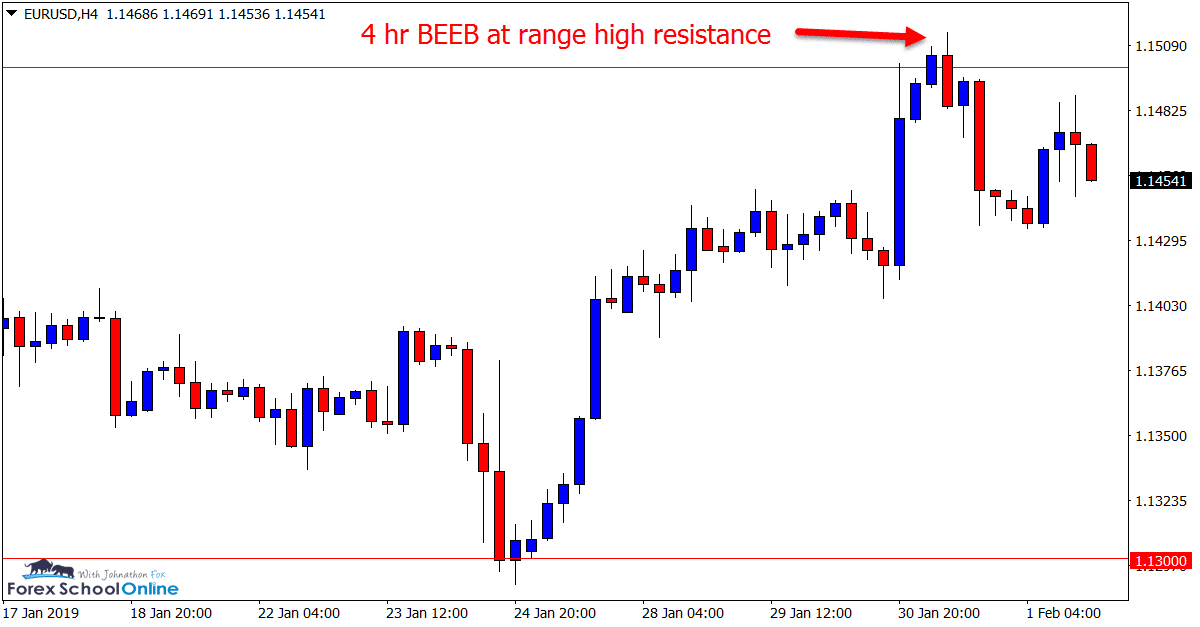
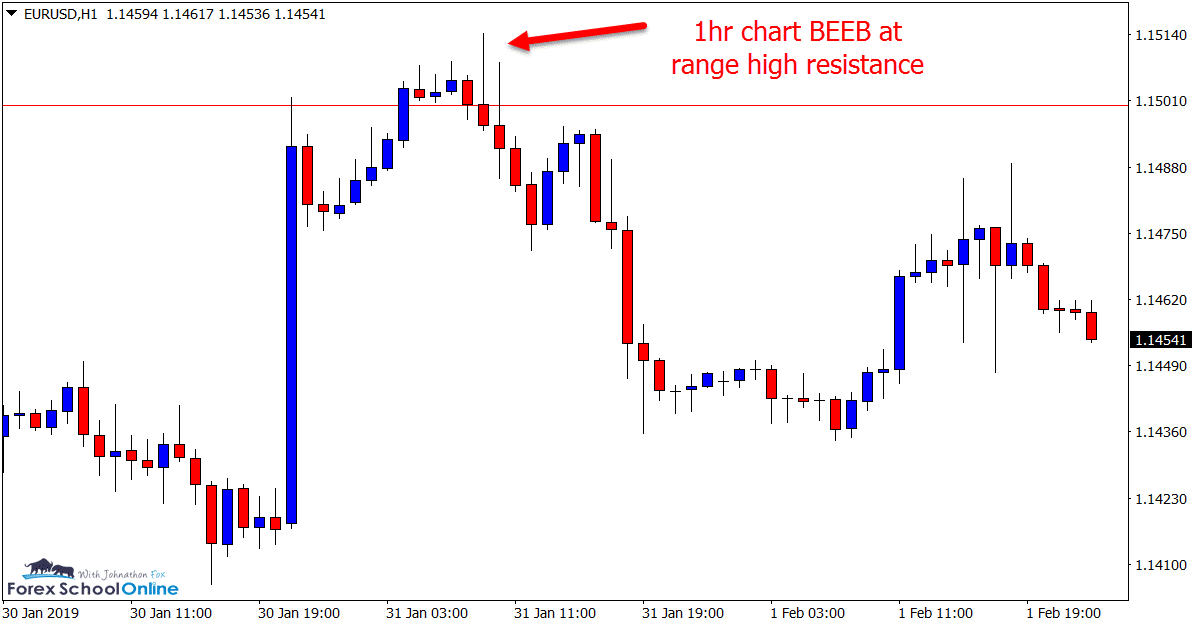
This week we saw another re-test and intraday rejection of the major daily resistance with price forming Bearish Engulfing Bars = BEEB’s on both the 4 hour and 1 hour time frames.
Price has since stabilized and formed an inside bar on the daily chart and the resistance remains a large watch for price potentially breaking the range.
Daily Chart
4 Hour Chart
1 Hour Chart
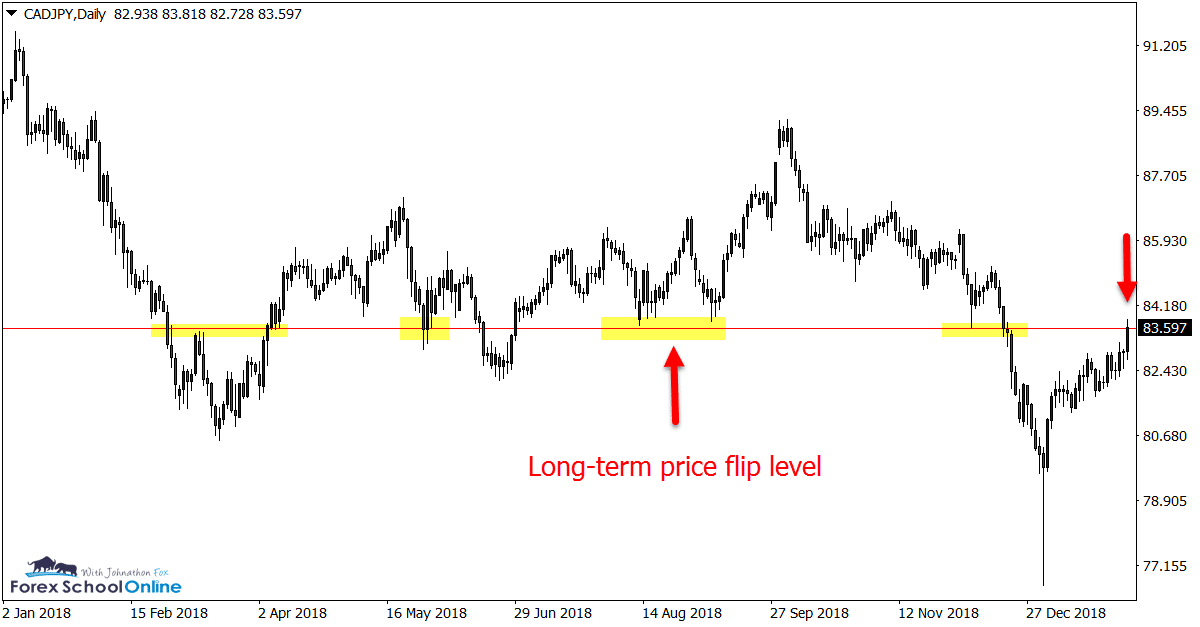
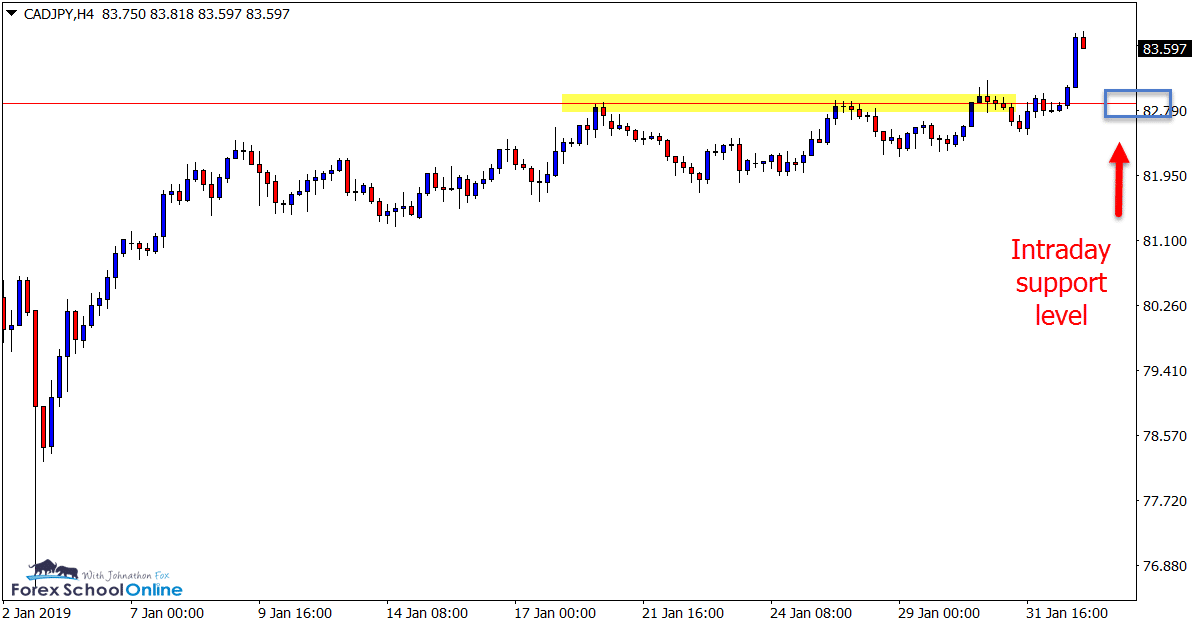
CADJPY Daily Chart
Test Long-term Resistance
Since forming a huge pin bar reversal on the daily chart down at the extreme lows, price has been moving aggressively higher.
As the zoomed out daily chart shows below; price has now moved into a longer term price flip level that in the past has been respected as both support and resistance.
Whilst the bulls have been in full control of this market and have shown no signs of giving over control, no market moves either straight higher or lower.
If price can pullback lower and into a value area of support, then there could be potential to trade inline with the strong momentum higher.
The 4 hour chart below shows the old resistance that could potentially hold as new support should price make a quick rotation lower.
Daily Chart
4 Hour Chart
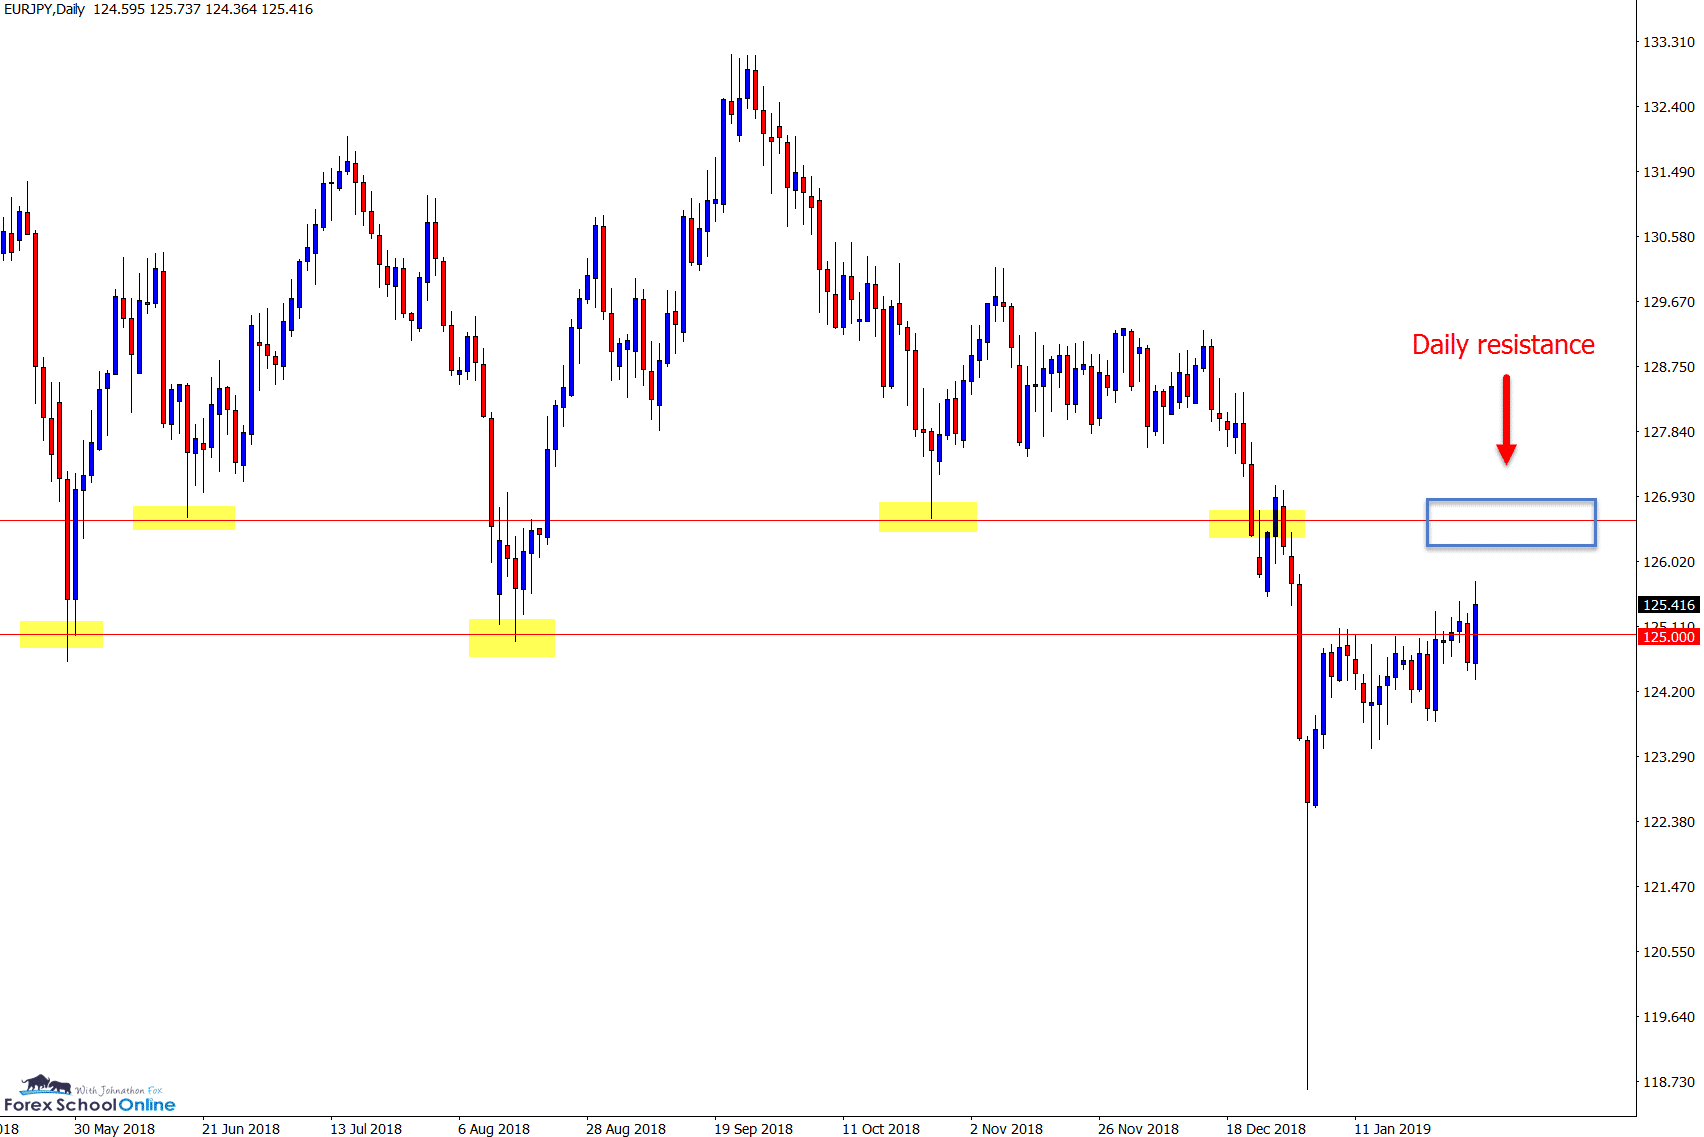
EURJPY Daily Chart
Bullish Engulfing Bar Breaks Higher
In the charts in focus of Jan 20th I discussed this market and how price action had been stalled by the daily resistance level.
As we look at the daily chart now we can see that price has formed a bullish engulfing bar = BUEB that is closing above this resistance level.
If price breaks the high of this engulfing bar and continues its move, we could see a quick break into the overhead resistance where bearish traders could look for high probability short trade setups.
Daily Chart
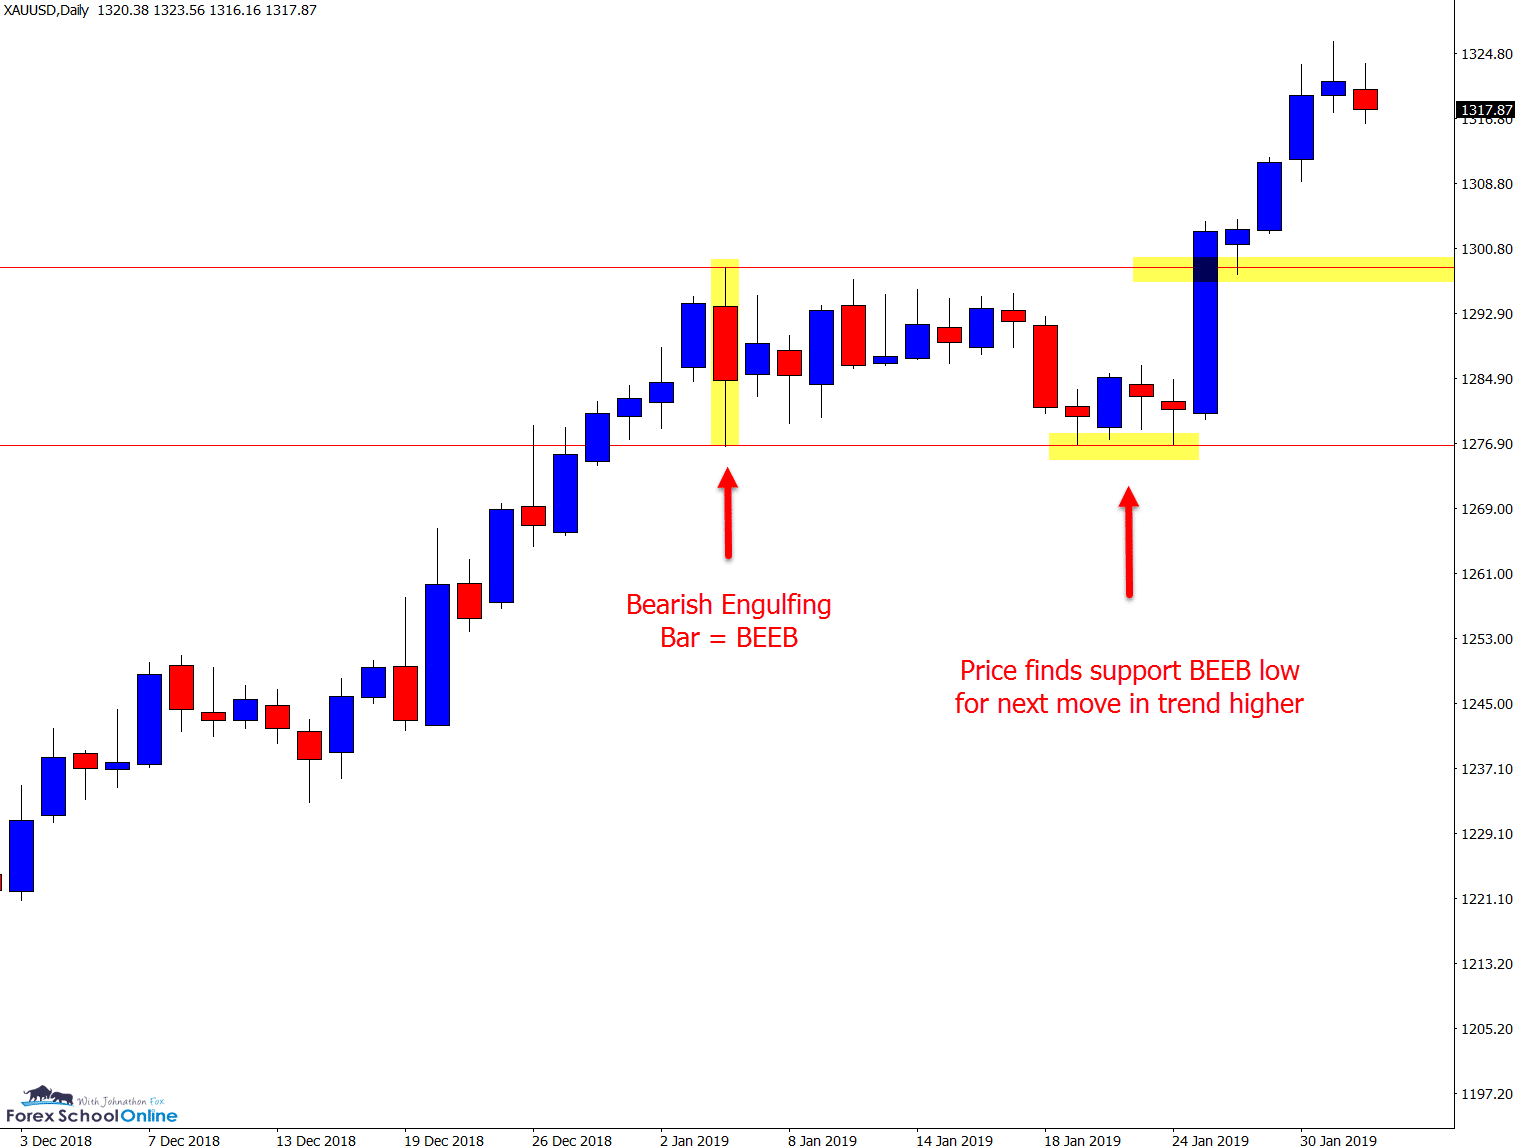
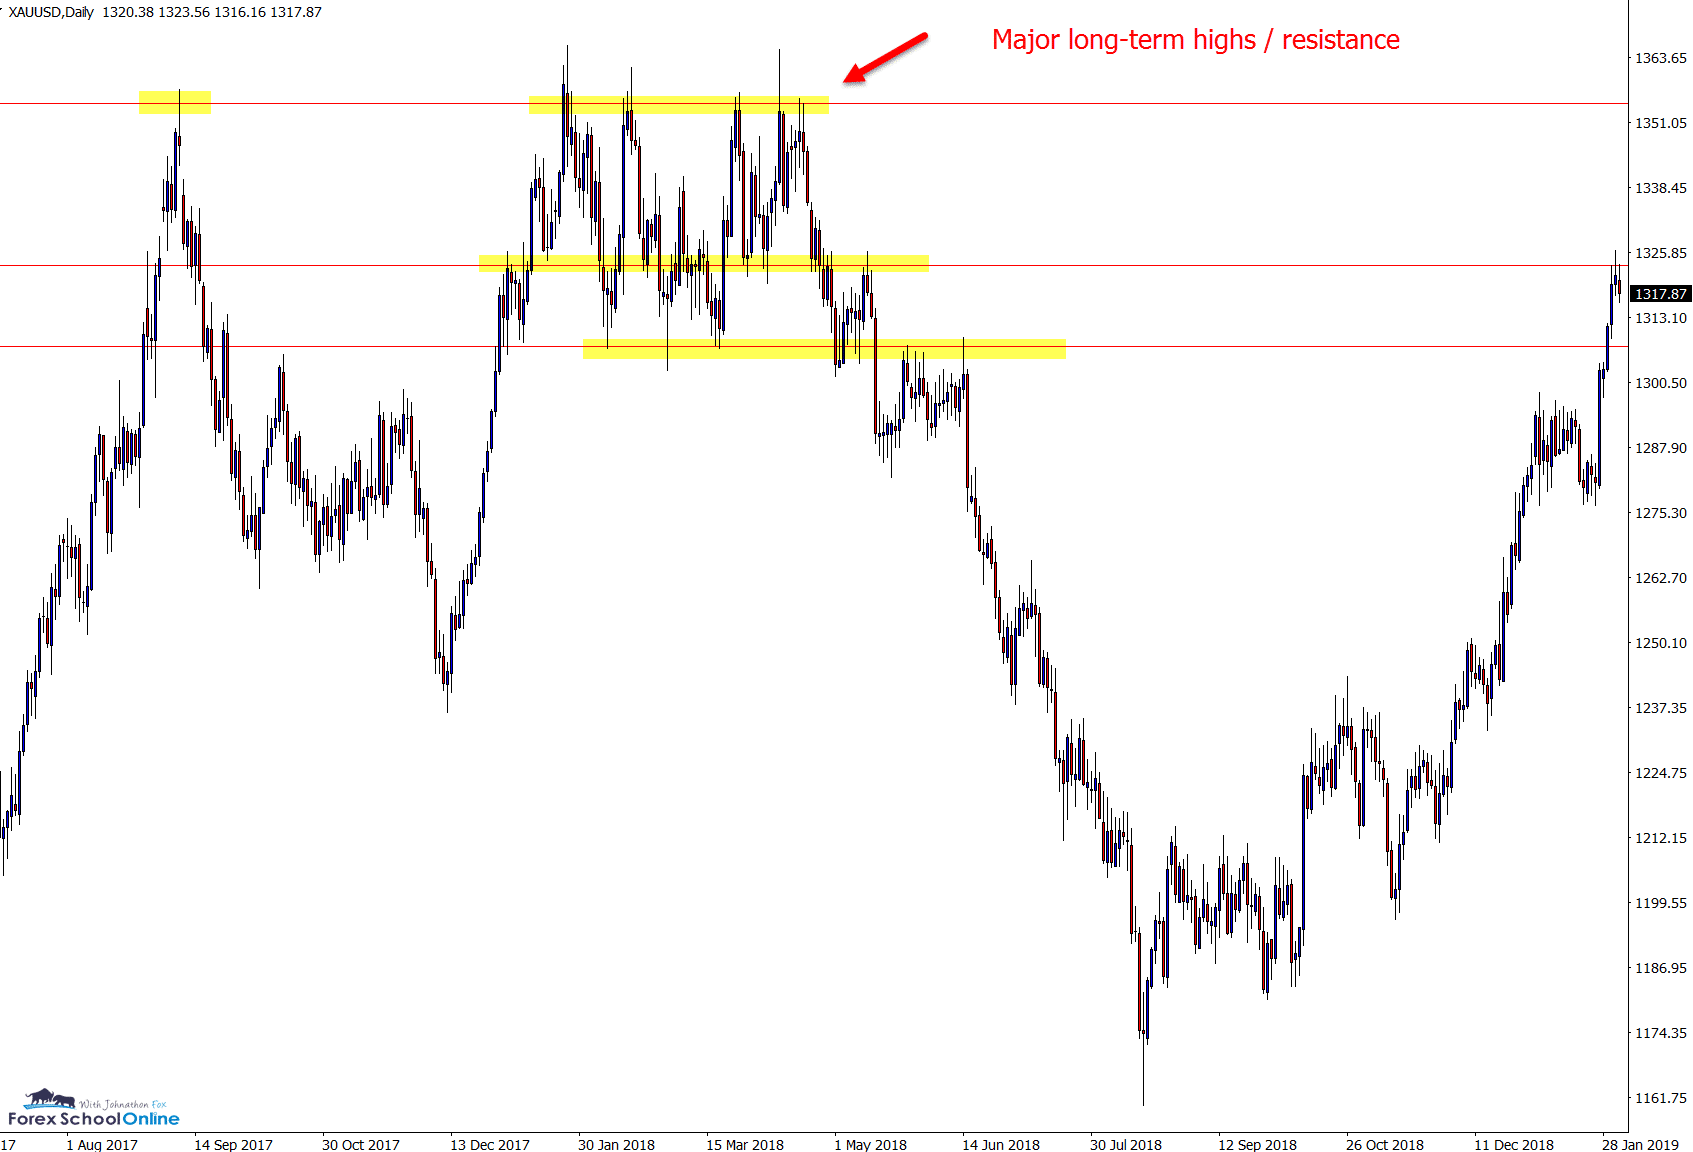
GOLD Daily Chart
Price Continues With Trend
This is a market has been doing a heck of a lot over the past few weeks and months. Since looking for price to make a reversal down at the lows and watching the new trend higher closely, we can see that price is now in full force higher.
The last charts in focus I discussed how price had not broken the high or low of the engulfing bar on the daily chart. Since then, price moved to the low of the engulfing bar, found support and continued with the next leg in the trend higher.
Price as I write this is testing a long-term resistance level. If this gives way we could see price make its ways to the major highs of 2018.
Daily Chart
Daily Chart
Note: We Use Correct ‘New York Close 5 Day Charts’ – Download Free New York Close Demo Charts Here
Charts in Focus Note: All views, discussions and posts in the ‘charts in focus’ are the view of Forex School Online and are not recommendations or trading advice. All posts are general in nature and are not advice to buy or sell.
Please leave questions or comments in the comments section below;

Many thanks for your free price action course. It’s awesome! I have a question though, that has been bothering me greatly, and I only wish that I’ll get a comprehensive response from you as MASTER of the game.
I trade on the 1 hour but going by your teaching to use the daily chart for setups, I wish to know at what point should I scale down to my 1 hour chart for trade entry? Is it when a signal is already formed on the daily chart or when price is at SR? Pls explain this in details. Once again, I thankfully appreciate your great work.
Hi Paul,
this takes a little bit to answer; I go through the exact steps on moving down time frames with routine here; https://www.forexschoolonline.com//ultimate-guide-marking-support-resistance-price-action-charts/
If still unclear after that let me know.
Johnathon
What I actually mean is whether I need to wait for the daily candle close at SR before taking a decision to hunt for trade signals on my 1 hour chart or wait until a clear signal forms at daily SR before going to my 1 hour chart to wait for signal? Thanks for taking the time to respond to my questions.
Hi Paul,
whilst looking to see how aggressively price can or cannot close above / below a level is a great clue as to what price is looking to do, you don’t always have to use it to look for smaller time frame trades.
Depending on how small the time frame you go to, if you wait for the close out you will often miss the break, first test and continue.
When you see price breaking you can look at the price action on smaller time frames to see the first re-test and what exactly price is doing at the old support / resistance.
https://www.forexschoolonline.com//first-test-support-resistance-price-action-trading-strategy/
Johnathon
Hi Mr.Fox
I honestly love your price action trades and as a newbie it is worthy information to start your day around it . I appreciate everything you do for us sir and have a blessed day.
Thanks Xolani.
Safe trading.
Johnathon
Sir, it’s a trade idea for “February”, not January 🙂 Thanks for the trade ideas.
Thanks ! 👍