Price on the EURUSD daily price action chart is moving higher and into a potential ‘kill zone’ level.
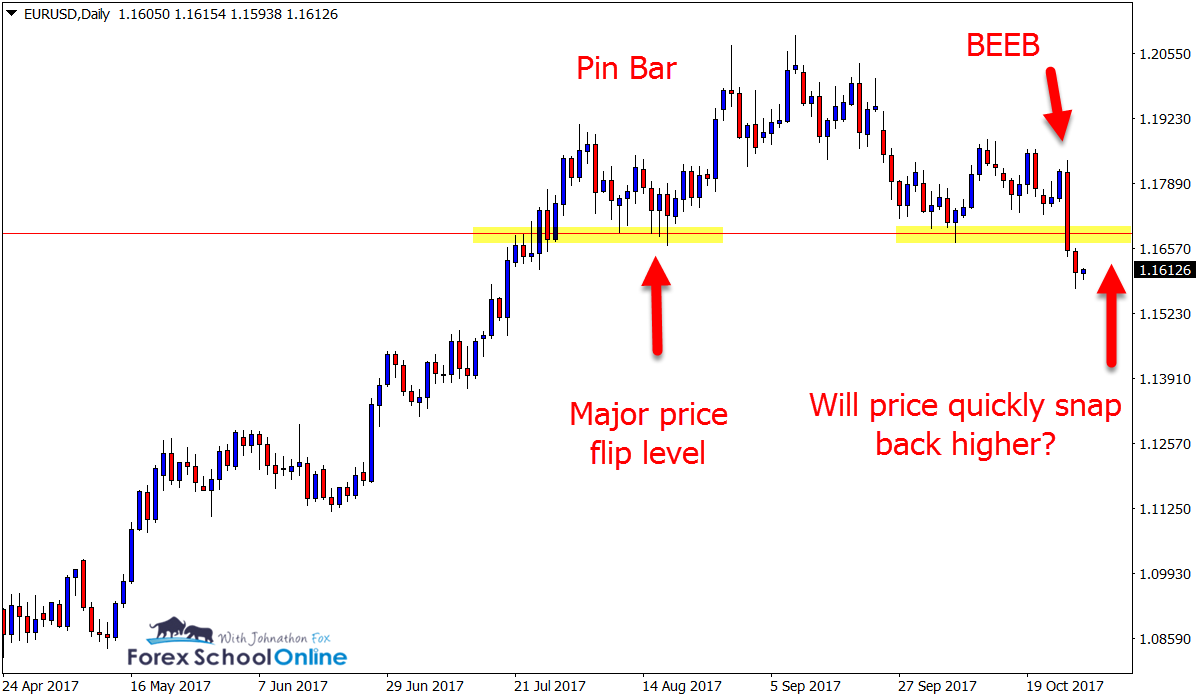
In the recent days and weeks price has formed a top with bearish pin bars rejecting the highs and now rolled lower. If you take a look at the charts below; you will see on the daily chart that price was in a strong trend higher before pausing and rejecting the highs and forming clear reversal and top pattern.
I discuss how price forms these clues, reverses trends in a price action market and also how you can look out for the clues in your own trading in the trading lesson; How the price action market makes major reversals
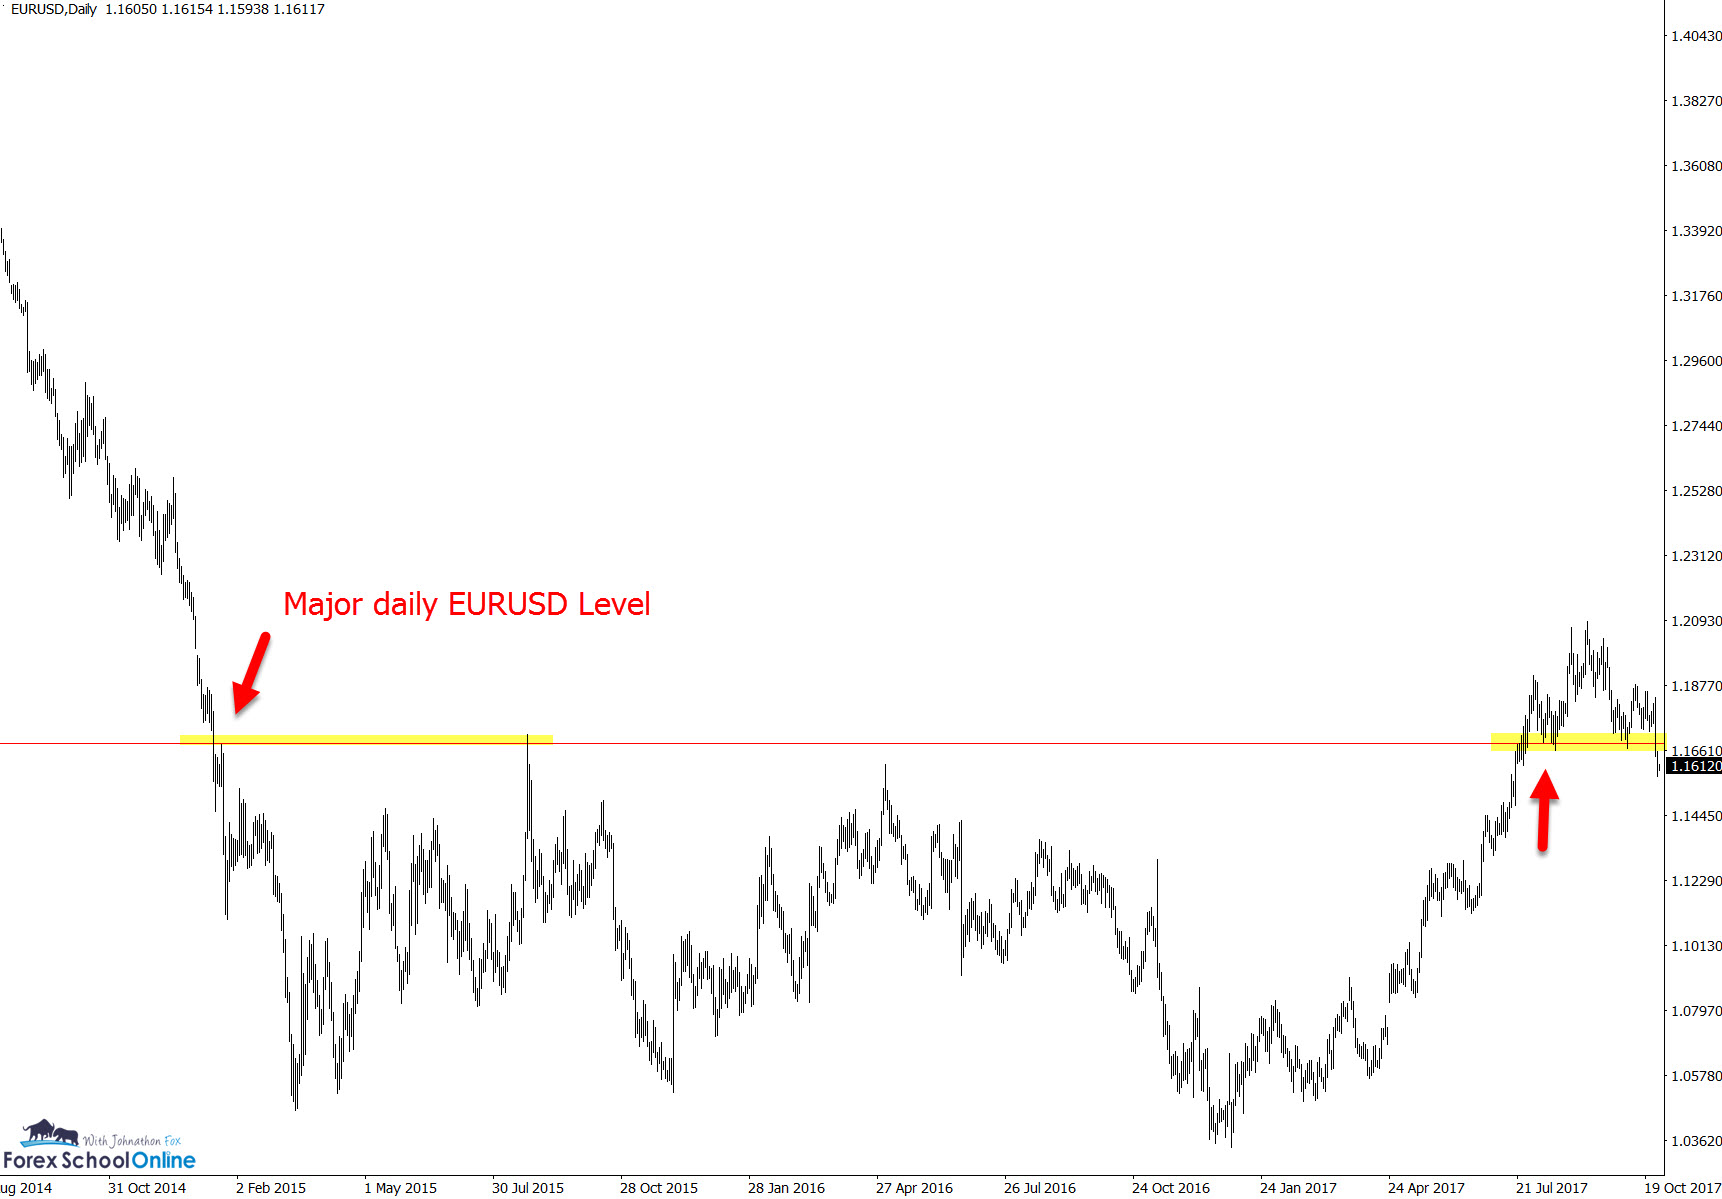
After making this top, we can see price has broken a major support level and this could prove to be really key because we are now watching to see if this level ‘flips’ and holds as an old support / new resistance level.
I go through for you in the lesson using price flips and kill zones how to use these high probability levels in your trading.
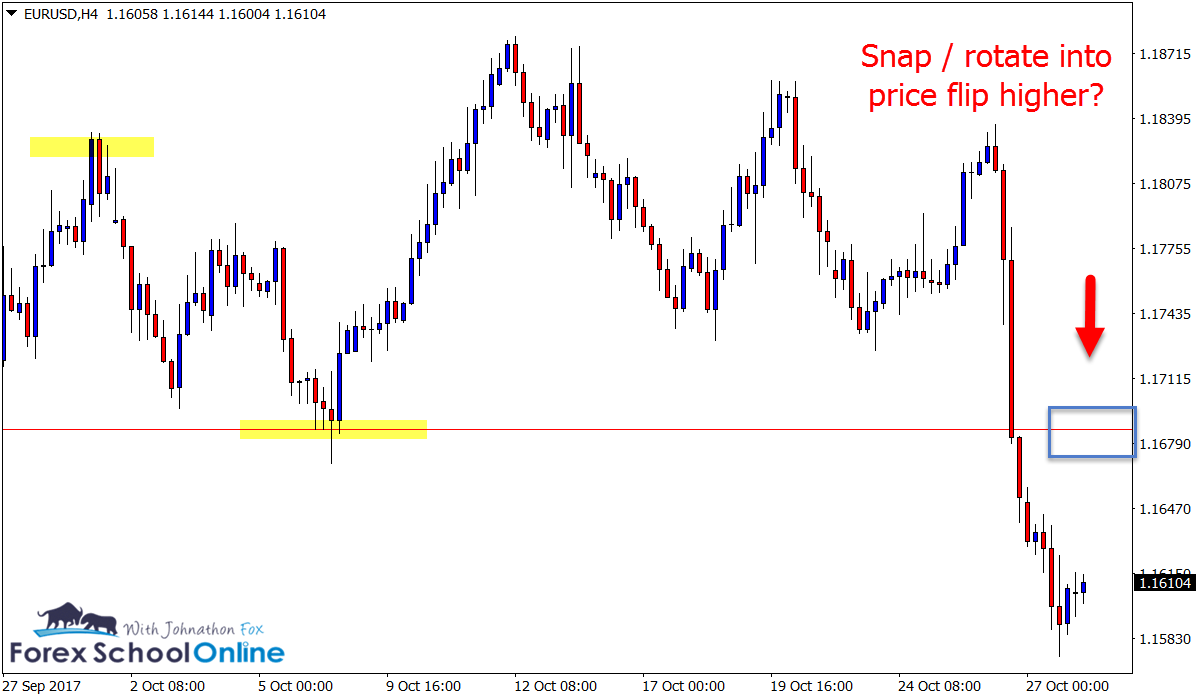
If price does make a quick pull-back into this level; it could potentially be a high probability level to look for bearish trade setups should price fire off any A+ short trade setups.
Trades could be hunted on the smaller intraday time frames because at this stage there would not be enough space to make a trade on the daily chart.
The best way to do it is always have your levels ready to go, setup and prepared. You are letting the market come to you and you are then just confirming with a trigger – not finding a trigger and making something up to confirm what you want to see!
Daily EURUSD Chart

Daily EURUSD Chart
4 Hour EURUSD Chart


Leave a Reply